PERFORMANCE EVALUATION, FUND SELECTION AND PORTFOLIO ALLOCATION APPLIED TO COLOMBIA’S PENSION FUNDS1
LUIS BERGGRUN PRECIADO*1, FERNANDO JARAMILLO RECIO2
1Ph.D. in Finance, Tulane University, United States. Associated professor, Finance Department, Universidad Icesi, Colombia. Research Group "Inversión, Financiación y Control" affiliated to Universidad Icesi, Colciencias B classification. lberggru@icesi.edu.co
2Master in Finance, Universidad Icesi, Colombia Professor, Universidad Icesi, Colombia. fejarami@yahoo.com
* Autor para correspondencia. Dirigir correspondencia a: Universidad Icesi, Calle 18 No. 122-135, Pance, Cali, Colombia.
Fecha de recepción: 02-09-2009 Fecha de corrección: 20-09-2010 Fecha de aceptación: 11-10-2010
ABSTRACT
This study examines performance of mandatory and voluntary pension funds in the 2004 – 2008 period. Furthermore, we present a methodology based on principal components that can aid affiliates when selecting funds. Moreover, we examine two portfolio optimization methodologies to evaluate any performance improvements in an evaluation period when choosing a particular methodology. The first one suggested by Markowitz (1952) and the second by Reveiz and Leon (2008b). We find an increase in risk, using several metrics, of mandatory and voluntary pension funds as well as a set of funds that better characterize the common movement of funds’ returns. No evidence was found in regards to economically or statistically significant gains of applying either optimization methodology using several holding periods.
KEYWORDS
Pension funds, performance, selection, optimal portfolios, persistence.
JEL classification: C61, G11, G14
RESUMEN
Evaluación, selección de activos y conformación de portafolios aplicados a los fondos de pensiones en Colombia
Este estudio examina el desempeño de fondos de pensiones obligatorios y voluntarios en el periodo 2004-2008. El documento presenta una metodología fundamentada en la técnica de componentes principales que facilita el proceso de selección de fondos. También se analizan dos metodologías de optimización de portafolios para evaluar mejoras en el desempeño en un periodo de evaluación, la primera sugerida por Markowitz (1952) y la segunda sugerida por Revéiz y Leon (2008b). Aplicando diferentes metodologías, se evidenció un incremento en el nivel de riesgo de los fondos obligatorios y voluntarios colombianos. Se halló además un conjunto de fondos que caracterizan adecuadamente el movimiento común de los retornos de los fondos. No se encontraron ganancias significativas en términos económicos ni estadísticos al utilizar una metodología de optimización en particular.
PALABRAS CLAVE
Fondos de pensiones, desempeño, selección portafolios óptimos, persistencia.
RESUMO
Avaliação, seleção de ativos e formação de portfólios aplicados aos fundos de pensões na Colômbia
Este estudo examina o desempenho dos fundos de pensões obrigatórios e voluntários no período de 2004-2008. Além disso, este documento apresenta uma metodologia fundamentada na técnica de componentes principais que facilita o processo de seleção de fundos. Também se analisam duas metodologias de otimização de portfólios para avaliar as melhorias no desempenho durante um período de avaliação. A primeira é sugerida por Markowitz (1952) e a segunda é sugerida por Reveiz e Leon (2008b). Aplicando diferentes metodologias, se evidenciou um aumento do nível de risco dos fundos obrigatórios e voluntários colombianos. Foi notado também um conjunto de fundos que caracterizam adequadamente o movimento comum dos retornos dos fundos. Não foram encontrados lucros significativos, nem em termos econômicos nem estatísticos, ao utilizar uma metodologia de otimização em particular.
PALAVRAS CHAVE
Fundos de pensões, desempenho, seleção portfólios ótimos, persistência.
INTRODUCTION
Colombia has both mandatory and voluntary pensions. In the former, affiliates to the pension system receive a pension, after making mandatory contributions during working years, by means of the pension fund administrators (Administradoras de Fondos de Pensiones -AFPs, for their abbreviation in Spanish) authorized by Law 50 of 1990 and/or by the Social Security Institute (I.S.S. for their abbreviation in Spanish). In the latter, of more recent introduction in Colombia, the affiliate, in order to supplement her income during retirement years makes contributions (that complement those mandated by the law) through her life cycle in a discretional manner.
Under the mandatory system, when affiliates are wage earners, the employer pays 75% of the total contribution while the employee pays the rest. When affiliates are independent workers they are obliged to cover the full cost of contributing to the system.
Under this system there are two affiliation alternatives, the first known as Individual Savings with Solidarity regime (e.g. defined contribution) in which an affiliate has the option of an early retirement if the accumulated capital in her account is able to finance monthly payments equivalent to 110% of the minimum monthly wage. This type of affiliation is run by non-government AFPs.
The second type is a defined benefit system (administered by the State through the I.S.S.) where the affiliate must contribute during a minimum weeks and comply with age requirements, in order to be entitled to receive a pension.
Pensions administered by AFPs rely on the capital contributed as well as the yields on these investments. By Law, private AFPs are obliged to secure a minimum return, determined by the Financial Superintendence, to its affiliates and if there is any extra return this goes completely to the affiliates’ benefit and not the AFPs’.
By September, 2008, the Colombian Association of Severance Pay and Pension Fund Administrators (ASOFONDOS for their abbreviation in Spanish) had 8.403.715 affiliates under the mandatory system for a total fund value of COP$56,3 trillion pesos (approximately USD$24,4 billion) and under the voluntary system it had 351.617 affiliates for a total fund value of COP$6,3 trillion pesos (approximately USD$2,7 billion). Thus, the welfare of a large share of Colombia’s future retired population will depend on the ability of mandatory and voluntary pension funds in generating adequate returns on investment to fund retirement needs of an ageing working force.
In Colombia, individuals opt for a voluntary pension plan namely for two reasons. The first one deals with an increase of personal savings to enjoy a more sizable pension, and the second is related with taking advantage of the non-taxation (or tax differing) of income that is deposited in the voluntary pension fund for at least five years. Tax rates on this income are gradual and can go as high as 34%.
There are both local and foreign AFPs which offer affiliations to mandatory as well as to voluntary pension plans. The difference from the point of view of the affiliate (and the yields she attains) is that while in the mandatory system the affiliate does not have to make portfolio allocation decisions (the AFPs manages only one portfolio for all their clients), under the voluntary system, the affiliate is confronted with a portfolio allocation problem in which she has to decide to invest in fixed and variable income assets both local and foreign (e.g. U.S., Europe, Japan, and emerging markets).
For affiliates, the initial attractive of voluntary pension funds was based on the fact of being able to get an early retirement without age restrictions, of obtaining a good pension in line with the funds’ returns and of having an individual account available to her heirs, a very different set of rights that those enjoyed by I.S.S.’s affiliates, where, for example, (pension) heirs are limited to the spouse and under age relatives.
However, the current financial uncertainty, stock prices’ drops, and a worldwide recession have negatively affected individual AFPs accounts and especially, the risk level affiliates are facing.
In the literature we found several studies on mandatory pension funds in Colombia that evaluate (portfolio) performance and how legal restrictions and current incentives affect investment policies and returns offered to affiliates. In particular, several papers have examined the impact of minimum return requirements and fixed commissions based on contributions and how these have created distortions and inefficiencies in the system that will end up hurting pensioners in the future.
To make the supply of mandatory funds more flexible thus taking into account age and income differences, the literature recommends the establishment of a multi-fund system, where affiliates would have to make portfolio allocation decisions (as in the voluntary system). In addition, several alternative risk measures (instead of variance) are suggested to better reflect affiliates’ risk and to build portfolios administered by AFPs.
The study of voluntary pension funds in Colombia is scant. Perhaps an exception would be Jara, Gomez and Pardo (2005)’s comment in the sense that risk-return characteristics of voluntary pension funds fall below efficient frontiers (both restricted and unrestricted) constructed from investments available to mandatory pension funds. However, this article leaves the explanation of this inefficiency open to future research.
The main contribution of this document is, in addition of studying performance of mandatory pension funds for the 2004-2008 period, to analyze performance of different investment alternatives (or funds) offered by two of the most representative voluntary pension funds as well as to propose a methodology to select assets that can be replicated by funds’ affiliates when making investment decisions. In other words, the portfolio allocation problem is focused on the point of view of the affiliate and not the fund per se.
Furthermore, we analyze setting up efficient portfolios according to the traditional methodology by Markowitz (1952) and an alternative approach by Reveiz and Leon (2008b) to verify the existence of improvements in portfolio performance when using a particular approach. If there is any improvement in performance, this can also help affiliates to make sounder portfolio decisions.
The rest of the document is organized as follows. The first section comprises a literature review focused mainly on mandatory pension funds. The second section presents the data and methodology of performance evaluation, asset selection, and portfolio allocation applied to pension funds. The third section discusses the results, and finally the fourth section includes some concluding remarks.
1. LITERATURE REVIEW
Markowitz (1952) is considered the forefather of modern investment theory. He proposed that the problem of selecting an optimal portfolio should only be considered in terms of the mean and variance of assets’ returns.
More specifically, Markowitz showed that the problem could be simplified as one of finding the portfolio that maximized returns at any given level of variance, or equivalently finding the portfolio that minimized variance returns at some level of portfolio returns. Solving this optimization problem, an investor can find the efficient frontier that shows different combinations of risk and return obtained with efficient portfolios that include only risky assets.
Reveiz and Leon (2008b) criticize Markowitz’s methodology since portfolio weights are very sensitive to optimization inputs, sometimes allocations can be counter – intuitive and due to the difficulties in forecasting the variance covariance matrix.
The article proposes a risk measure related to that of Roy (1952), which tries to capture extreme portfolio losses and it complies with several desirable characteristics in any given risk measure and in particular its asymmetric treatment of negative and positive returns and sub - additivity.
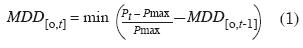
The risk measure is known as the maximum drawdown that can be understood as the worst percentual change in an assets’ price from its maximum (max) to its bottom in a particular period (t).
The maximum drawdown (MDD) can be estimated recursively given a price series P as the minimum (min) of,
As an alternative to the mean variance (MV) optimization, Reveiz and Leon (2008b) propose to maximize the cumulative return (or wealth creation according to the authors) to drawdown in what is usually known as the Calmar Ratio.
They solve an optimization problem with eighteen assets and notice that the estimated frontier shares some similarities to Markowitz’s frontier and report diversification benefits (while taking into account extreme events) when including more assets in the frontier.
Even though this methodology entails some advantages in comparison to Mean variance optimization in regards to an estimation free of distributional assumptions, it shares many of its shortcomings since it can genertate (in a dynamic setting) unfeasible portfolio weights and highly unstable portfolio configurations given the fact that this methodology does not correct for sampling error.
Moreover, it is highly debatable the authors’ assertion that this optimization is especially attractive to pension funds because it concentrates on the long term given, that it implicitly assumes that historic wealth creation will be highly correlated with future wealth creation (a similar point was criticized regarding the historic variance and covariance matrix). This assertion does not recognize mean reversion in returns, a pattern thoroughly described in the financial time series econometrics literature.
Lohre, Neumann, and Winterfeldt (2008) examine diverse risk measures, among them, value at risk (VaR), conditional VaR, lower partial moments, skeweness, and maximum drawdown, as well as a negative exponential utility function in a portfolio allocation problem.
In an out of sample performance analysis for a sample of high capitalization European shares, they found that optimized portfolios out performed benchmark portfolios except for those optimized by minimizing VaR and the skewness coefficient. Furthermore, risk control did not have a significant cost in regards to lowering returns of optimal portfolios. Specifically, the article finds that using some measures such as the semivariance, a negative exponential utility function and maximum drawdown, contributed to significant improvements in terms of ex-post risk reduction regardless of the way returns are forecasted (Lohre et al., 2008).2
Leon and Laserna (2008) apply the wealth creation - drawdown criterion to estimate representative optimal portfolios for Colombia’s mandatory pension funds from investments in local and international fixed income, equities and currencies. Foreign fixed income showed a particular importance in optimal portfolios as a means to mitigate risk and minimize drawdown.
They compare performance of twenty efficient portfolios estimated with the mean-variance and the wealth creation–drawdown methodologies (though the portfolios given their different compositions are not strictly comparable) using data from January, 2000 to December, 2007 (Leon and Laserna, 2008). Average (in-sample) returns for 19 out of 20 portfolios estimated through the wealth creation – drawdown approach turned out to be higher than average returns for mean- variance portfolios and a bit surprisingly, the results showed that differences decreased (as to become zero for the 20th portfolio) for the higher return portfolios. This reduction in relative advantage for higher return portfolios is not very attractive for the drawdown methodology since intuitively one would expect a relaive improvement of performance in portfolios were extreme events are more prevalent (i.e. portfolios with high return and drawdown) (Leon and Laserna, 2008).
One of the weaknesses of the Leon and Laserna’s document is that some results can be labeled as samplespecific, because no analysis was conducted for different estimation periods to reach more general conclusions and since the performance test was an in-sample one in which the authors used the same data to estimate the frontiers and assess performance, giving the impression that a perfectly positive correlation exists between mean returns (or wealth creation) and ensuing returns.
This evidence is hard to hold in practice (one would have an infallible performance forecasting method) and thus an advisable exercise would have been, for instance, to split the sample in two and estimate efficient portfolios using the first period and examine performance in the second half and then determine if the supposed dominance of the wealth creation and drawdown methodology really held.3
Jara (2006) develops a theoretical model to analyze the behavior of mandatory pension funds in setting their portfolio policy under current legislation. In a single period setting, the model shows that if funds are not constrained by mandating investment limits and by requiring them a minimum return estimated as a function of returns of the IGBC, S&P500 and a reference portfolio designed by Colombia’s Financial Superintendence that includes CDs and TES, funds have an incentive to maximize Sharpe’s ratio (even when one includes the minimum return restriction) and to choose efficient portfolios related to a certain risk aversion level (of the funds’ shareholders) quantified through a CARA (Constant Absolute Risk Aversion) utility function.
When the model is extended to several periods, it is seen that the optimal portfolio no longer is an efficient one and in return, pension funds start to imitate the minimum return portfolio (determined by law). Since this minimum return requirement is determined with a tri-annual investment horizon, the probability of not attaining the minimum increases prompting a rise in funds’ risk aversion and herd behavior in the sense of imitating the reference portfolio or the competition’s portfolios.
In the model, when commissions are tied to returns and the reference portfolio is a mean-variance efficient portfolio, optimal decisions by the funds would lead them closer to the efficient frontier with the ensuing benefits to the funds’ affiliates.
Martinez and Murcia (2008) argue that in the current mandatory pension system, in many cases more than 50% of the funds for an affiliate to retire would come from reinvestment of contributions, thus it is highly advisable to incentive funds to maximize their portfolios’ returns. However, current legislation that allows funds to charge a commission on contributions and requires them to provide a minimum return to its affiliates incentives herd behavior as well as administrative and marketing efforts (instead of efficient portfolio decisions) in order to attract new affiliates.
To revamp these incentives, Martinez and Murcia (2008) argues for a mix of commissions based on contributions (to cover the fixed costs of a fund) and on annual returns in excess of a reference portfolio to improve the replacement rate (percentage of the final salary paid as monthly pension) of affiliates and to prompt pension funds to optimize performance since this will increase their profits.
Reveiz and Leon (2008a) analyze how a series of investment restrictions enacted by the Financial Superintendence curtails the ability of funds to optimize performance (e.g. Sharpe ratio) and lowers their portfolio diversification with suboptimal consequences for the funds’ affiliates.
The authors propose a simple diversification benefit measure that tries to capture the reduction in returns’ standard deviation comparing the correlation of returns of a portfolio versus the case where all correlations of assets in a portfolio are set to one. Through an optimization exercise they find that unrestricted efficient frontiers dominate restricted frontiers and that the latter had a lower range of possible returns as well as lower diversification benefits. Given the aforementioned and the current inflexibility of Colombia’s pension fund regime, the article proposes a multi-fund system as it has been functioning in other Latin American countries,4 that would mitigate investment restrictions and would incentive the setting of portfolios more closely resembling the population needs. In particular, the authors propose the establishment of five funds with different risk-return characteristics.
To quantify the funds’ level of risk, Reveiz and Leon (2008b) propose the maximum drawdown measure (instead of the variance) as a way to distinguish among funds offered to affiliates with different ages and risk aversions. In short, affiliates closer to retirement should set (and have access to) portfolios with minimum drawdowns while younger affiliates could tolerate portfolios with higher drawdowns since they can wait longer for a market recovery after a market downturn.
Arango and Melo (2006) analyze the determinants of affiliation to a mandatory pension fund in Colombia from 1998 to 2005 using panel regressions. In other words, the article tries to research the factors that caused certain funds to gain market share (e.g. Porvenir, Protección, and Skandia) in the period at the expense of other funds (e.g. Colfondos, Horizonte, and Santander).
The authors show that the change (that took effect in April, 2004 onwards) in the way minimum returns were estimated5 eased the fund ability to surpass this minimum threshold and empirically find that this minimum return requirement is naturally related to the funds’ returns, that this change (in fact decrease) after April 2004 of the minimum returns had a negative impact in funds’ performance and more interestingly how the changes in the minimum return had a differential effect among the funds (interaction dummy for each fund with the minimum return).
In their regression analysis, Arango and Melo (2006) try to explain the number of contributing (or active) affiliates as a function of funds’ returns, employed population and the value of a fund in regards to the number of affiliates, the latter variable proxying for other funds’ characteristics connected to the ability of attracting clients. They find that the number of affiliates, returns and employed population share a long term relationship (e.g. they are cointegrated) that in turns causes that increases in returns and the share of employed population get reflected on increases in the number of funds’ affiliates.6
From this empirical evidence, Arango and Melo (2006) propose relaxing investment restrictions to the funds (and minimum return guarantees) and support tying administration commissions to performance instead of linking them to monthly contributions (as a fixed percentage).
In Latin America, Zurita and Jara (1999) analyze performance of Chilean pension funds. The authors are critical of periodical reports by the Superintendence to the general public regarding the funds’ performance since these reports only contemplate returns and not risk. They go on to discuss several measures that not only consider returns but also risk, among them Sharpe’s ratio, Jensen’s alfa, market timing indicators, stochastic dominance, lower partial moments and the like.
Zurita and Jara (1999) consider Sharpe’s ratio as the best performance measure in the context of the Chilean market since this measure assumes that a great proportion of the affiliates’ wealth is tied to his pension (in other words, the affiliate is not entirely diversified) and this measurement does not depend on any theoretical model (e.g. CAPM) mitigating the need for a reference or benchmark portfolio.7
Analyzing performance from 1987 to 1998, they proceed to rank funds according to Sharpe’s ratio and average returns but the article recognizes that these rankings are sensitive to the time period used. However, they find that the correlation of rankings based on Sharpe’s ratio and average returns is high regardless of the estimation window used (last 3 or 5 years). Finally, they analyze the issue if there is a link between past and future fund performance that would evidence persistence in returns and fund managers’ ability. They conclude that the evidence is weak since rankings’ correlations (using either criterion) for the different time windows (sometimes overlapping) in few occasions were significant and these correlations tended to fall as windows were farther apart.
2. DATA AND METHODOLOGY
2.1. Data
This study uses weekly (Friday to Friday) unit fund values in Colombian pesos (COP$) from September, 2004 to September, 2008 of mandatory pension funds Colfondos, Horizonte, ING (formerly Santander), Porvenir, Protección, Skandia Alternativo, and Skandia Obligatorio. The source of this information is ASOFONDOS.8
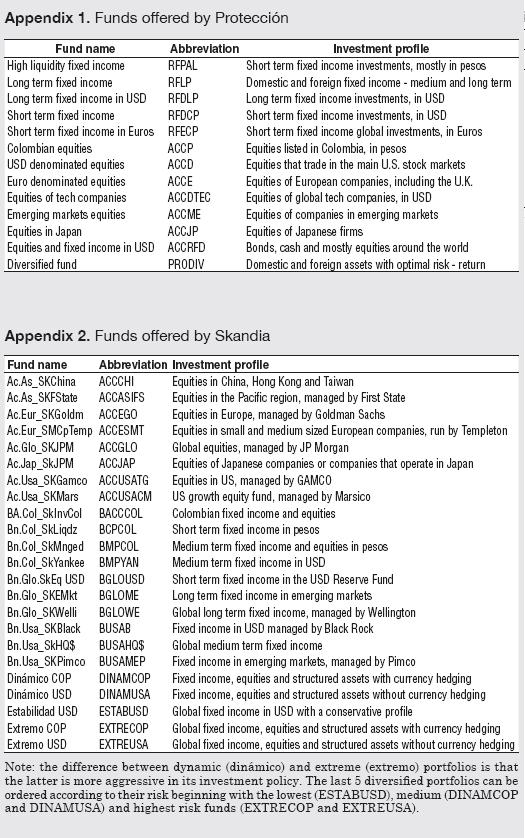
The weekly unit fund value from September 2004 to June 20089 of 23 and 13 funds (portfolios or investment alternatives) offered by voluntary pension funds Protección and Skandia10 respectively (for details see Appendix 1 and 2) comes from companies’ websites.
As a risk free rate we chose the interbank rate. The interbank rate is the rate certified by Colombia’s Central Bank for inter-bank operations excluding operations among other financial intermediaries such as financial corporations and cooperatives. The source of this information is Bancolombia.11
2.2. Performance evaluation of funds
This section uses several measures found in the literature that not only measure performance in terms of returns but also account for risk. The purpose of this analysis is not necessarily to rank funds (since sometimes these measures produce different rankings) but to give a general perspective on performance and to provide an assessment of the degree of risk that pension fund affiliates have been confronted with in the last years. The performance measures are:
2.2.1. Sharpe’s ratio
Sharpe’s ratio (SR) is given by:
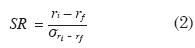
Where ri represents the historical return of fund or portfolio i,rf is the risk free rate, and σri-rf is the standard deviation of excess returns. This measure allows assessing the excess return to risk ratio. Naturally, as the ratio increases, the performance of a fund improves.
2.2.2. Lower partial moments
Lower partial moments give valuable information on the probability that an asset’s returns fall below a certain threshold,12 on the expected value of the loss in these scenarios and the variability of returns in these circumstances.
Measuring lower partial moments can be more readily understood using the concept of the kth moment of a probability distribution. The kth moment of returns will be:
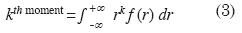
Where r represents returns and f (r) the probability distribution of returns. The zero moment by definition is 1 and it is related to a probability of occurrence, the first moment represents the mean and the second the variance of returns. Lower partial moments modify the upper bound on the integral for a given threshold (i.e. zero). In short, the zero partial moment that measures the probability of negative returns will be:
The zero moment by definition is 1 and it is related to a probability of occurrence, the first moment represents the mean and the second the variance of returns. Lower partial moments modify the upper bound on the integral for a given threshold (i.e. zero). In short, the zero partial moment that measures the probability of negative returns will be:

The first partial moment will be given by:

This moment represents the expected value of the loss given a negative return. It is frequently referred to as expected shortfall. It provides information with respect to risk since it takes into account the amount lost and not only its frequency (as the zero partial moment).
Finally, the second partial moment can be estimated as:

This indicator is analogous to the variance (therefore it is known as semivariance) and it measures dispersion of returns below a certain threshold.
2.2.3. Maximum drawdown
Maximum drawdown can be understood as the maximum percentage decline (from peak to bottom) in an investment on a certain period of time (t). Its formula, repeated here, can be expressed as:

Maximum drawdown then tries to estimate losses associated with extreme events. A risk averse investor will choose among two assets with identical returns the one with the lowest drawdown.
2.2.4. Second order stochastic dominance
According to this criterion, portfolio i will stochastically dominate portfolio j if:

G(r) and F(r) represent the cumulative distribution functions (CDF) of portfolio j and i returns respectively. By using the cumulative distribution function of return this more comprehensive analysis not only incorporates means and variances of returns as in classical (financial) optimization theory but also other moments of the return distribution.
This means that if i dominates j, the cumulative area below the CDF of j must be larger than the cumulative area for i. Second order stochastic dominance can be more readily understood in the context of two assets having the same mean, in which case the asset with the lowest variance will be the dominant one.
In this section we formed pairs for both mandatory and voluntary pension funds’ returns to examine the existence of stochastic dominance.
2.3. Fund or asset selection through principal components analysis
Frequently, voluntary pension funds affiliates can choose among an ample selection of funds that sometimes show a high degree of similarity, making it difficult to pick a particular fund. In other words, given high correlation in funds returns and similar investment policies, the process of selecting portfolios turns complicated (see Appendix 1 and 2 for details).
The multivariate statistics technique of principal components can aid in this selection problem through dimensionality reduction. This technique achieves, for instance, given a number of variables, a different set of orthogonal variables that are combinations of the original ones known as principal components. These principal components have a high explanatory power of the common variance of the original variables.
More specifically, the analysis starts with the analysis of the eigenvalues (λi) of a square matrix (covariance or correlation matrix of dimension n (number of assets) by n denoted by ∑) and the eigenvectors (vi) associated to these particular eigenvalues, from which the following relation holds:
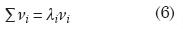
From r (returns) which we can assume as an nx1 vector with covariance matrix ∑, we can estimate c, which is a vector of the same dimension, as a linear combination of r by using the following expression (where Ai stands for the ith file of the square matrix A):
c=Ar (7)
The coefficients of A act as weights that can be normalized thorough the expression AiA’i = 1 . Given this, the variance and covariance of c can be estimated as:
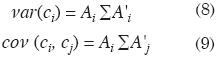
Where i and j stand for rows of A. The idea of principal components is to maximize the variance while achieving a zero covariance (cov(ci,cj)). Solving this optimization problem one can find the values of matrix A which will be equal to the transpose of the matrix of eigenvectors (ordered in descending order according to their eigenvalues). The first principal component will be the eigenvector associated with the highest eigenvalue and so on.
Taking into account that the sum of the eigenvalues equals the sum of the original (standardized) variables, each eigenvalue will explain

To reduce dimensionality, usually a researcher chooses the most representative principal components. Despite the fact that there is no consensus in the literature about the threshold or explanatory power necessary to retain a particular eigenvalue, two criteria are to retain eigenvalues higher than 1 or eigenvalues with explanatory power equal or above 5%.
We conducted a principal component analysis on the correlation matrix of returns of Protección and Skandia funds. Principal components associated with eigenvalues above one were retained and the correlation of funds returns and principal components was analyzed.13
The correlation of fund i returns and principal component j is given by:
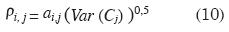
ai,j represents the coefficient of fund i in the eigenvector related to principal component j .
The funds with a high correlation with a given principal component (and low correlations with the rest) were selected for a subsequent analysis. These funds with a high correlation can be interpreted as those funds better representing a principal component.
2.4. Portfolio allocation analysis
With the funds chosen in the last section, we proceeded to attain optimal portfolios through two methodologies: the first related to Markowitz (1952) and the concept of an efficient frontier in which by an optimization process those portfolios that a given return minimize variance are chosen, and a second methodology by Reveiz and Leon (2008b) in which those portfolios that at the same level of wealth creation minimize drawdown.14
Both methodologies produce an efficient frontier in which each point represents risk and return characteristics of a particular portfolio. In both cases restrictions were imposed in the optimal weights (no short sales) and the analysis was conducted on 100 optimal portfolios equally spaced from the portfolio with lowest returns (wealth creation) to the highest.
With these optimal portfolios it was possible to conduct a hold out sample performance analysis using a fixed size rolling window of 52 weeks. This window served both as portfolio formation or estimation period and holding period. In the first estimation, we took the first 52 weeks to estimate the optimal portfolios and analyzed its average return in the next 52 weeks (starting from week 53). The second estimation used data from weeks 2 to 53 and performance was analyzed in the next year and this process was repeated until the data permitted.
If persistence effects are present in the data or in other words optimal portfolios are subject to momentum (Jegadeesh and Titman, 1993), one would expect that high ex-ante or historical returns portfolios (high up in the frontier) would show a better performance on a subsequent period.
To examine this empirically, we conducted, in a rolling fashion, a correlation analysis among the 100 returns on the frontier and the 100 average returns in the evaluation period. We estimated the correlation with the first estimation window, the second and so on. To generalize these results the same exercise was conducted for different estimation and evaluation periods from 28 up to 52 weeks.
In practice, momentum effects would give affiliates to a particular fund indication of a pattern of returns they could take advantage of and these effects could serve as guide to switch from one fund to other (where momentum effects would be stronger).
Furthermore, we analyzed the expost return series (weekly averages) of the portfolios under the two optimization methodologies to verify any performance improvement when using one particular approach. Likewise, in a robustness analysis, this exercise was replicated for different windows from 28 and up to 52 weeks. If there is any improvement in performance when choosing a particular method this can aid affiliates to make sounder investment decisions.
3. RESULTS
This section discusses the results on performance of mandatory pension funds and then the performance analysis, fund selection and portfolio allocation applied to two of the most representative voluntary pension funds (Protección and Skandia) for the period 2004 – 2008.
3.1. Performance analysis of mandatory pension funds
Table 1 shows descriptive statistics of returns for the whole sample.
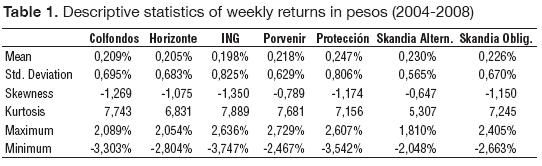
The Table 1 shows that the most profitable fund in the period (September 2004 – September 2008) was Protección followed by Skandia Alternativo. The least profitable fund was ING (formerly Santander). On a yearly basis, the difference between the most and least profitable funds was about 2,55% per annum.
Even though the least profitable fund, ING was the riskiest one (nevertheless with a moderate yearly volatility of 5,95%); the second and third riskiest funds were Protección and Colfondos, and the least risky fund was Skandia Alternativo with a weekly volatility of 0,565% (or 4,07% per annum).
All funds showed negative skewness, being Skandia Alternativo and Porvenir the funds with skewness closer to zero. Similarly, all funds presented positive kurtosis (in excess of 3), evidence of fat tails in returns’ distributions. Maximum and minimum returns fluctuated roughly around +/- 3%.
To further these findings, a second order15 stochastic dominance and performance analysis was conducted as described in section 2.
Table 2 below shows the results for a stochastic dominance analysis. In the table, a value of 1 depicts the case where the fund in the row dominates the fund in the column and a value of 0 stands for the case of no dominance. For interpretation purposes, the sum of the values in each row gives an idea of how many times the fund in the row dominates and the sum of values for each column represents the number of times that the fund in the column is dominated by the rest.
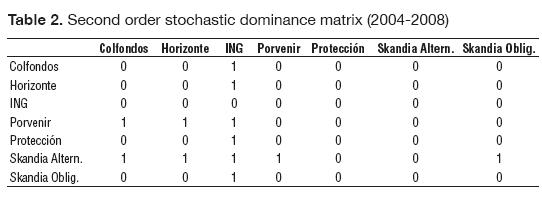
Matching in good part the descriptive statistics analysis, it is seen that all funds dominated ING fund, that Porvenir and Skandia Alternativo dominated Colfondos and Horizonte and that the only two funds not dominated by their competitors were Protección and Skandia Alternativo. It can also be said that the best performer was Skandia Alternativo since it dominated most of the funds (except Protección). Interestingly and even though the two funds are run by the same company, Skandia Alternativo dominated Skandia Obligatorio. In addition, in unreported results, the risk free rate was nor dominant nor dominated by the funds’ returns.
In regards to performance analysis taking into account risk, Graph 1 shows the evolution of several performance measures using a fixed length rolling window of 26 weeks (six months).16 We decided to work with an estimation period of six months since Colombian law allows affiliates to migrate from one fund to the other after having completed a minimum period of stay of at least a semester. Initially, the graph shows similar performance patterns across the seven funds, a result in line with the literature review in section 1.
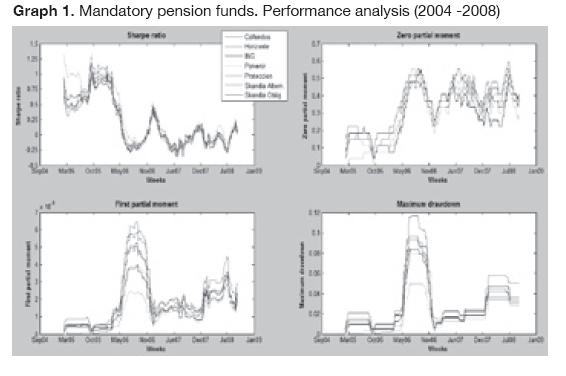
Looking at the evolution of Sharpe’s ratio one notices an increasing trend for the first 30 weeks (from March to September, 2005) followed by a decreasing trend reaching a minimum in July 2006 and then a recovery until the end of 2006. During 2007 and 2008 (week 97 onwards), this indicator has been erratic and more importantly, in several occasions turned out to be negative. By the end of the sample (last week of September, 2008), Sharpe’s ratio of mandatory pension funds was within a 0,05 and 0,15 range.
The zero partial moment has changed from levels of 10 to 20% from MarchSeptember of 2005 to levels of 60% in June-July of 2008. In other words, rolling probabilities (with a six month window) of negative returns changed by a factor of six in a three year period. For the whole period, the frequency of negative returns for all funds approached, on average, 30%.
Given negative returns, the first partial moment informs the size of the expected percentage loss. At the beginning of the sample, expected loss was moderate and fluctuated around 0,05 and 0,10%. Starting on February, 2006, the expected loss grows considerably until reaching a maximum of 0,60% in July-August, 2006. For the set of funds, the average first partial moment for the whole period fluctuated from 0,115% (mean for Skandia Alternativo) and 0,208% (Protección).
Maximum drawdown showed a similar behavior to that of the first partial moment, reaching a maximum of 11,70% in July-August, 2006. By the end of the sample, this indicator showed levels between 2,87% and 5,00%, drawdowns far lower than those of the July-August, 2006 period. On average for the whole period, maximum drawdown ran from 1,84% (mean for Skandia Alternativo) and 3,58% (ING).17
3.2. Performance evaluation, fund selection and portfolio allocation applied to Protección’s voluntary pension fund
This section begins with a principal components analysis to select funds to then analyze its performance and conduct a portfolio allocation analysis.
3.2.1. Fund selection applied to Protección’s voluntary pension fund
A principal component analysis was undertaken on the funds’ returns for the period extending from October, 2004 to September, 2005. This period is long enough to allow us to apply a principal component analysis and this length mitigates non-normality concerns.
Table 3 shows that four components are able to explain 80% of the joint variance of returns. In the bottom of the table, correlations (Corr) of the 13 funds with the four principal components (C) are shown.
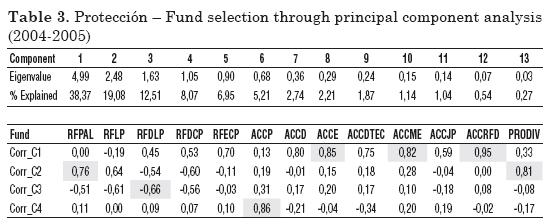
The first principal component is strongly related to ACCRFD (0,95), ACCE (0,85) and ACCME (0,82). Though ACCD showed a high correlation with C1, we decided to exclude it since three funds represent well enough variability explained by C1. RFPAL and PRODIV showed high correlations with C2, while C3 and C4 strongly correlated with RFDLP and ACCP.
The first principal component, given the equally signed coefficients for most of the funds seems to represent a market or general factor, the second principal component seems to represent a return factor accounting for a difference between local and foreign fixed income (mind the low coefficients on funds investing in equities), the third component seems to account for differences in returns per type of assets (equities versus fixed income) and the fourth does not have a discernible pattern (maybe it is related to a factor affecting returns in equity markets outside the U.S. and Europe).
The seven (underlined) funds are those that an investor can choose if she is willing to be exposed to different risk factors (markets, currencies, asset types, nationalities, among others). These are the funds with the highest (in absolute terms) correlations with risk factors. In other words, these are the funds that better characterize the common movement of funds’ returns.
3.2.2. Performance evaluation applied to Protección’s voluntary pension fund
Table 4 shows some descriptive statistics for the funds selected in the last section for the period reaching October, 2005 to September, 2008.
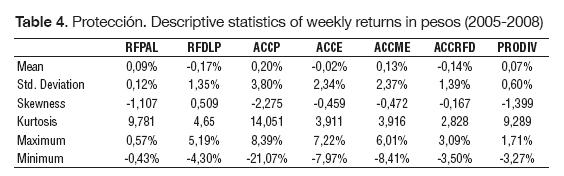
The most profitable funds were ACCP, ACCME and RFPAL; while in general, funds that invested in currencies such as RFDLP, ACCE and ACCRFD had negative returns. The riskiest funds (standard deviation) were ACCP, ACCE and ACCME while the least risky fund was RFPAL and PRODIV. In a traditional meanvariance analysis, it is seen that RFPAL dominated all funds except the ones with higher returns (ACCP and ACCME). In addition, PRODIV dominated RFDLP, ACCE and ACCRFD.
All funds showed negative skewness (except for RFDLP) and significant kurtosis. Comparing the funds that invested in pesos (RFPAL, ACCP y PRODIV) with the rest of the funds, it is seen that these funds had more pronounced skewness and kurtosis and values farther apart of those of a normal distribution.
A stochastic dominance analysis showed that RFPAL dominated the rest funds (except for ACCP and ACCME) while PRODIV dominated RFDLP, ACCE y ACCRFD. Table 5 reports these results.
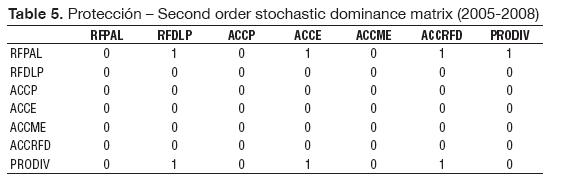
Interestingly, in unreported results, the risk free rate dominated most of the funds except for ACCP. Graph 2 shows the performance of the indicators of Proteccións’ funds.
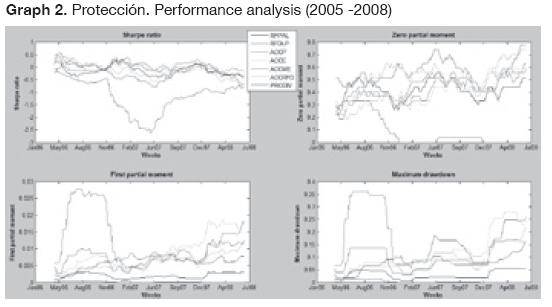
Sharpe’s ratio varied from -0,5 to +0,5 with the exception of RFPAL. By and large, there is a downwards trend in the period. On average, Sharpe’s ratios were negative except for ACCE and ACCME.
The zero partial moment shows an increasing trend for most of the funds until reaching an 80% level at the end of the sample. Though the riskiest fund, ACCP did not present the highest zero partial moment. On average, RFDLP and ACCRFD (55,56% and 52,17%) showed higher values than ACCP (44,86%). The rest of the funds (with the exception of RFPAL) showed averages around 40%.
From April to October, 2006, ACCP showed substantial levels in regards to its first partial moment, for instance, in that period, expected loss was around 3% per week. However, after 2007, ACCP reduced notably its expected loss until been surpassed at the end by other funds investing in foreign equities (ACCE and ACCME). Ranking through averages (for the whole period), the fund with the largest expected loss was ACCP (1,25%), followed by ACCE (0,90%), while the fund with the lowest loss was RFPAL (0,01%).
Finally, the maximum drawdown showed a similar behavior to that of the first partial moment. The highest drawdown funds (on average) were ACCP (15,67%) and ACCE (11,38%) while the ones with the lowest were RFPAL (0,29%) and PRODIV (3,05%).
3.2.3. Portfolio allocation applied to Protección’s pension funds18
With the seven selected funds we proceeded to estimate efficient frontiers through the two methodologies discussed in section 2.
If persistence effects are present, the correlation between the returns of efficient frontier portfolios and returns in a holding (ex-post) period should be high and positive.
Table 6 depicts the value of average correlations using several formation and holding periods between 28 and 52 weeks for the two optimization techniques (Mean variance and wealth creation –DD). The mean correlation is estimated by averaging, given a particular estimation window, the rolling correlations between ex-ante and ex-post returns of 100 portfolios in the frontier.
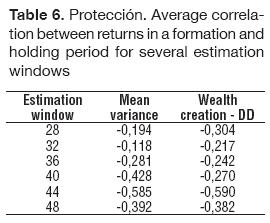
Analyzing the series of rolling correlations (unreported here), we observed correlations with values close to +/-1 for different periods and windows without any clear cut pattern or improvement when using either of the two methods.19
Returning to Table 6, it is perceived that average correlations are all negative. For the two methods there is a propensity of declining correlations (they turned more negative) as the window size increases. Correlations reported here do not provide evidence of persistence pattern nor of improvement in performance for either method in the sense of securing high future returns based on past returns.
To conclude this section, we analyzed returns using several formation and holding windows for portfolios nr. 20, 40, 60 and 80, derived under the two methodologies. Table 7 shows the results.
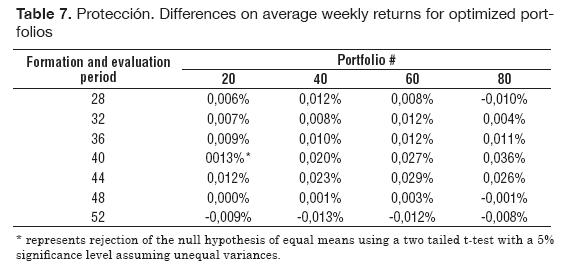
The value of 0,006% can be interpreted as the difference between average returns (for different rolling windows of equal size set to 28 weeks) of portfolio #20 obtained through minimizing drawdown and (minus) minimizing variance. This difference in yearly terms is 0,322%. Though strictly speaking portfolio #20 has a different composition under the two methodologies (and it is time varying as well), the table does not provide evidence of statistically20 nor economically significant differences in performance when using either optimization methodology applied to Proteccións’ pension funds.
3.3. Performance evaluation, fund selection and portfolio allocation applied to Skandia’s voluntary pension fund
3.3.1. Fund selection applied to Skandia’s voluntary pension fund
We conduct a similar analysis to that of Protección. Table 8 reports the principal components analysis carried to reduce the number of funds for further analysis.
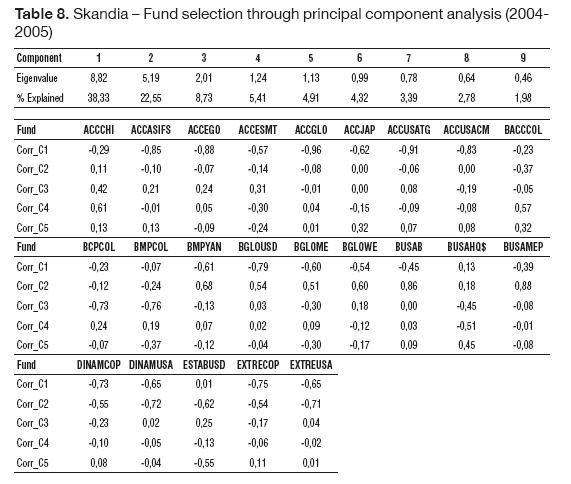
Due to space considerations, Table 8 presents the percentage explained by the first nine principal components. It is easy to see that from the eight principal components onwards explanatory power falls below 3%.
The first five principal components explain around 80% of common variability of returns. C1 is closely related to ACCGLO, ACCUSATG, ACCEGO and ACCASISFS, C2 is closely linked to BUSAMEP and BUSAB, while BCPCOL and BMPCOL are strongly correlated to C3. ACCCHI and ESTABUSD showed the highest correlations with C4 and C5 respectively.
C1 seems to represent a general market movement, C2 relates to a return factor having a differential impact on local and foreign fixed income (low correlations with equity funds) while the third component seems to reflect return differences across asset classes (fixed and variable income).
3.3.2. Performance evaluation applied to Skandia’s voluntary pension fund
Table 9 shows descriptive statistics of the ten funds chosen in the last section.
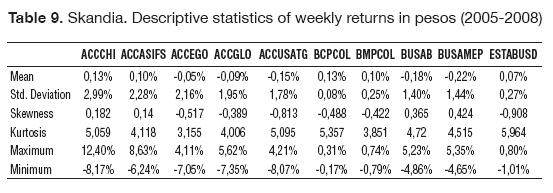
Five out of ten funds showed negative returns, all of them related to foreign investments. The most profitable fund was ACCHI while the least profitable was BUSAB. In terms of standard deviation, the riskiest funds were ACCHI and ACCASIFS while the least risky were BCPCOL and BMPCOL. Four out ten funds showed positive skewness and when skewness was negative, it tended to be of a lower magnitude to that reported by Proteccións’ funds. Kurtosis exceeded three, likely implying non-normal return distributions. In unreported results we found only three cases of second order stochastic dominant assets (BCPCOL, BMPCOL and ESTABUSD). As in Protección’s case, the risk free rate dominated the whole set of Skandia’s funds. Graph 3 shows a series of performance indicators.
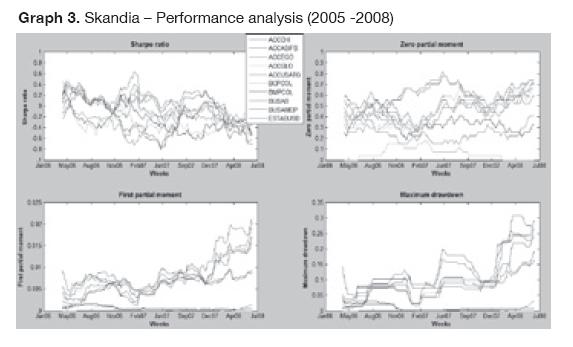
Sharpe’s ratios21 showed a declining trend and a certain convergence by the end of the sample. By and large, Sharpe’s ratio fluctuated around -0,75 and 0,50 and a bit worryingly some funds showed negative ratios for most of the period (BCPCOL, BMPCOL, BUSAB, and BUSAMEP).
The zero partial moment evidenced an increasing trend with a peak (for some funds) by the end of the sample (June, 2008). Funds such as ESTABUSD, BMPCOL, and BMPCOL showed low frequencies of loss while BUSAB and BUSAMEP showed the highest losing frequencies (on average of 59,45% and 58,78%).
BCPCOL and ESTABUSD showed very little expected losses while ACCHI and ACCEGO showed the largest losses amounting to 0,88% and 0,79%. Interestingly, by the beginning of 2008 there is a separation phenomenon in which funds can be classified in three groups (high, medium, and small shortfall) according to their first partial moment.
Maximum drawdown showed a similar path to that of the first partial moment. However, if one ranks funds (not shown here) from low to high first partial moments and drawdowns (averages for the sample), orderings are not completely analogous. For instance, ACCASIFS surpassed six funds in terms of expected loss but it exceeded only three in terms of drawdown.
By and large, performance of voluntary pension funds has worsened while their risk has increased (whatever the metric) in the last years. In addition, mandatory pension funds have out-performed most of voluntary pension funds of Protección (except for ACCP) and Skandia at a fraction of the level of risk (standard deviation). Likewise, voluntary pension funds have had a lackluster performance even when compared to the risk free rate.
3.3.3. Portfolio allocation applied to Skandia’s pension funds22
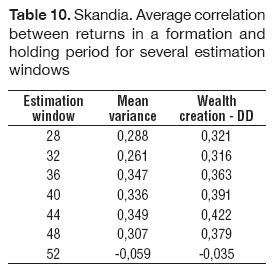
As in the case of Protección, no evidence was found in regards to returns’ persistence of optimized portfolios. Table 10 shows the results. Though correlations are mostly positive, their value (the highest was 0,422) does not allow us to conclude that ex-ante and ex-post performance was strongly linked. Although correlations reported for the second methodology were higher, the differences with respect to the more traditional methodology were minimal.
Finally, our analysis did not find economically significant return differences in an evaluation period when using either methodology for a range of different estimation windows. Table 11 reports these results.
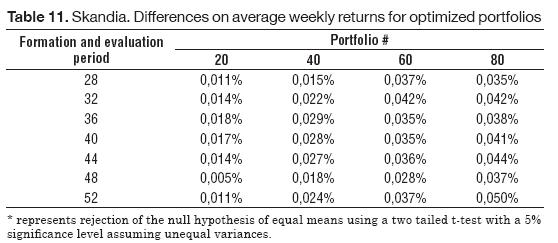
The lowest difference was 0,005% (0,282% per annum) while the highest was 0,050% (2,585% per year). Nonetheless all differences reported here are positive (though of modest value), for the case of other portfolios (and windows) not reported sometimes the differences were negative. None of the differences reported here were statistically significant.23
In sum, no evidence was found of any improvement in performance when applying either of the two methodologies to the funds offered by Skandia.
4. CONCLUDING REMARKS
This document analyzed performance of Colombia’s mandatory pension funds for the 2004 – 2008 period, a time span in which these funds, affected by a world crisis, experienced a decline in performance. Though these funds are subject to investment restrictions and minimum returns clauses that provoke similar investment behavior, this document found time differences on the levels of risk assumed by the affiliates of these funds. In addition, some funds’ returns stochastically dominated other
funds’ returns.In regards to performance of voluntary pension funds we found a decline in funds’ performance and an increase in risk (whatever the metric) in the last years. Moreover, we found that mandatory pension funds outperformed voluntary pension funds offered by Protección (with the exception of ACCP) and Skandia, at a much lower level of risk (standard deviation). Likewise, voluntary pension funds had a sub-optimal behavior even when compared to the risk free rate, a finding derived from a stochastic dominance analysis. These results give credence to calls by Arango and Melo (2006), Jara (2006) and Martínez and Murcia (2008) in the sense of linking voluntary pension funds commissions to its return performance (instead of linking them to the fund size as in the current system).
These results also reinforce the popular perception that funds’ returns have been mediocre and perhaps the only benefit of participating in these funds is the possibility of differing or eliminating income taxes if contributions are deposited for a minimum of five years. However, the methodology presented here does not pretend to solve the question put forward by Jara et al. (2005) in the sense of how much responsibility to assign of this mediocre performance to fund managers and affiliates since the latter have an influence in portfolio decisions when they rebalance their portfolios. Naturally, this rebalancing can affect funds returns.
Nonetheless, and reviewing the portfolio composition of some funds investing in foreign equities through overseas portfolio managers one notices a certain propensity to invest in shares of large and growth companies (instead of investing in small and value companies). Particular examples are the funds ACCASIFS, ACCUSACM, ACCE, and ACCRFD.
Growth companies are those that usually had recent stellar performances reflected in high market valuations (high market to book, price earnings ratio, and other valuation indicators) implying high market expectations while the value companies represent the contrary. Nevertheless, empirical international evidence (Fama and French, 1998) seems to support investments in small and value companies (over investments in large and growth companies), especially in the long run.
Through a principal components analysis we were able to objectively choose a number of funds that properly represent the joint movement of all funds’ returns. In practice, this technique can help an affiliate to reduce the number of funds or assets to consider taking into account that nowadays the number of supplied funds have increased (e.g. closed alternatives by Protección), making it harder to keep track of all alternatives.
None of the two voluntary pension funds analyzed showed patterns of persistence in the short run, and on the contrary, we documented reversion patterns by which portfolios with higher historical returns tended to present a sub-par performance in a subsequent period when compared with portfolios with lower historical returns. For Protección funds, this evidence suggests a rebalancing portfolio period no longer than six months.
Furthermore no evidence was found in relation to improvements in performance when using a particular portfolio optimization methodology (Markowitz, 1952; Reveiz and Leon, 2008b). We consider these results robust given the different estimation and evaluation periods chosen on data availability criteria. In addition, both methodologies produced unstable portfolio allocations24 in time that restrict practical application of these approaches or demand a high number of optimization restrictions as described in Arcos, Benavides and Berggrun (2010).
One extension of this research would be to conduct a performance evaluation (especially for voluntary pension funds) with respect to benchmark portfolios and another would be to expand this methodology of assessing performance, selecting assets and finding optimal portfolios to severance pay funds in Colombia that by September, 2008 had 4,5 million affiliates and a fund value of more than COP$4,2 trillion (approximately USD$1.900 million).
FOOTNOTE
1. Este documento fue seleccionado en la convocatoria para enviar artículos, Call for Papers, realizada en el marco del Simposio "Análisis y propuestas creativas ante los retos del nuevo entorno empresarial", organizado en el marco de celebración de los 30 años de la Facultad de Ciencias Administrativas y Económicas de la Universidad Icesi y de los 25 años de su revista académica, Estudios Gerenciales, el 15 y 16 de octubre de 2009, en la ciudad de Cali (Colombia). El documento fue presentado en las sesiones simultáneas del área de "Economía, Estado y sector público".
2. The document explores two ways of forecasting returns conditional on a given level of tracking error. The first assumes a perfect prediction of returns while the second uses historical averages. In both cases results were similar.
3. Our article does this kind of analysis. See sections 3 and 4 below for more details.
4. In Chile, affiliates have the option to chose between five funds (A, B, C, D, and E) clearly differentiated by their risk tolerance and specifically on the proportion of equities in the portfolio. In addition, fund A being the riskiest one is forbidden to affiliates 55 and older (Reveiz, Leon, Laserna and Martinez, 2008).
5. This caused a decrease in the minimum required return as well as a drop in the reference portfolio return.
6. The size of the fund turned out to be insignificant.
7. In some cases the choice of a benchmark is difficult given the inexistence of benchmarks for mixed portfolios (equities and bonds) and given the investment restrictions pension funds face.
8. Retrieved in 2009, from http://www.asofondos.org.co
9. We chose this terminal date since Protección changed the supply of funds in that period. Extending the sample beyond June would have complicated analysis and comparability in a later period.
10. As of October, 2008, these two funds had a combined 66% market share.
11. Retrieved in 2009, from http://www.grupobancolombia.com
12. The most common thresholds are the mean and zero. In this article we will use them latter.
13. Since selecting a given number of principal components did not reduce the number of funds, we recoursed to a correlation analysis between the funds’ returns and principal components to find the funds more strongly correlated with linear combinations of the whole set of funds.
14. These optimization problems were solved using our Matlab program through the ‘quadprog’ and ‘linprog’ routines respectively.
15. This article omits a first order stochastic dominance analysis since often times the cumulative probability functions crossed preventing the existence of dominance.
16. We conducted the same analysis using a window of 52 weeks (one year) with similar results. These results are available from the authors upon request.
17. Due to space considerations and given similar results to those reported for the first partial moment, the analysis of the second partial moment is omitted.
18. We conducted the same analysis for the whole set of Protección funds (13 funds) for which we had historical data. Results are similar to the ones reported in this section.
19. These results are available from the authors upon request.
20. Out of 700 t-tests estimated (100 portfolios times seven different estimation windows) only 64 (9,1%) rejected the null of equal means.
21. Results obtained with a 52 week estimation window were similar to those reported here. These results are available from the authors upon request.
22. We conducted the same analysis for the whole set of Skandia funds (23 funds) for which we had historical data. Results are similar to the ones reported here.
23. Out of 700 t-tests estimated only 33 (4,70%) rejected the null of equal means.
24. The results of the time series of portfolio weights attained under the two methodologies are available from the authors upon request.
BIBLIOGRAPHIC REFERENCES
1. Alonso, J.C. and Berggrun, L. (2008). Introducción al análisis de riesgo financiero. Cali: Universidad Icesi.
2. Arango, L.E. and Melo, L.F. (2006). Determinantes de la Elección de Administradora de Pensiones: Primeras Estimaciones a partir de Agregados. Borradores de Economía, Central Bank of Colombia, 2315.
3. Arcos, M., Benavides, J. and Berggrun, L. (2010). Optimal portfolio allocation for Latin American stock indices. Revista Cuadernos de Administración, 23(40), 191- 214.
4. Berggrun, L. (2005). Currency Hedging for a Dutch Investor: The Case of Pension Funds and Insurers. DNB Working papers, Netherlands Central Bank, Research Department, 54.
5. Berkelaar, A., Coche, J. and Nyholm, K. (Eds.) (2009). Strategic Asset Allocation for Central Banks and Sovereign Wealth Managers. Hampshire, UK: European Central Bank – World Bank – BIS, Palgrave Macmillan.
6. Bodie, Z., Kane, A. and Marcus, A.J. (2005). Investments (6th ed.). Boston, MA: McGraw-Hill Irwin.
7. Copeland, T.E., Weston, J.F. and Shastri, K. (2005). Financial theory and corporate policy (4th ed.). Boston, MA: Addison-Wesley.
8. Dowd, K. (2005). Measuring market risk (2nd ed.). Hoboken, NJ: John Wiley & Sons.
9. Elton, E.J. (2007). Modern portfolio theory and investment analysis (7th ed.). Hoboken, NJ: John Wiley & Sons.
10. Elton, E.J. and Gruber, M.J. (1997). Modern portfolio theory, 1950 to date. Journal of Banking & Finance, 21(11-12), 1743-1759.
11. Fama, E.F. and French, K.R. (1998). Value versus Growth: The International Evidence. Journal of Finance, 53(6), 1975-1999.
12. Jara, D. (2006). Modelo de la Regulación de las AFP en Colombia y su Impacto en el Portafolio de los Fondos de Pensiones. Borradores de Economía, Central Bank of Colombia, 3238.
13. Jara, D., Gómez, C. and Pardo, A. (2005). Análisis de los Portafolios Pensionales Obligatorios en Colombia. Ensayos sobre Política Económica del Banco de la República, December.
14. Jegadeesh, N. and Titman, S. (1993). Returns to Buying Winners and Selling Losers: Implications for Stock Market Efficiency. Journal of Finance, 48(1), 65-91.
15. Leon, C. and Laserna, J.M. (2008). Asignación Estratégica de Activos para Fondos de Pensiones Obligatorias en Colombia: Un Enfoque Alternativo. Borradores de Economía, Central Bank of Colombia, 4970.
16. Lohre, H., Neumann, T. and Winterfeldt, T. (2008). Portfolio Construction with Downside Risk (working paper). Retrieved from http://papers.ssrn.com/sol3/papers.cfm?abstract_id=1112982
17. Markowitz, H. (1952). Portfolio Selection. Journal of Finance, 7(1), 77-91.
18. Martínez, O. and Murcia, A. (2008). Sistema de comisiones de las administradoras de fondos de pensiones en Colombia. Reporte de Estabilidad Financiera, Central Bank of Colombia.
19. Reveiz, A. and Leon, C. (2008a). Administración de Fondos de Pensiones y Multifondos en Colombia. Borradores de Economía, Central Bank of Colombia, 4598.
20. Reveiz, A. and Leon, C. (2008b). Efficient Portfolio Optimization in the Wealth Creation and Maximum Drawdown Space. Borradores de Economía, Central Bank of Colombia, 4732.
21. Reveiz, A., Leon, C., Laserna, J.M. and Martínez, I. (2008). Recomendaciones para la modificación del régimen de pensiones obligatorias de Colombia. Ensayos Sobre Política Económica, 26(56), 78-113.
22. Roy, A.D. (1952). Safety-First and the Holding of Assets. Econometrica, 20(3), 431-449.
23. Zurita, S. and Jara, C. (1999). Desempeño financiero de fondos de pensiones. Estudios Públicos, 74, 227-254.