Research article
DOI: 10.18046/j.estger.2021.161.3973
The development of cities supported by communication and information technologies
El desarrollo de las ciudades apoyado en las Tecnologías de la Información y la Comunicación
O desenvolvimento das cidades apoiado nas tecnologias da informação e comunicação
* Associate professor, Department of Biological Sciences and Sustainability, Universidade Paulista, São Paulo, Brazil. Full Professor, Faculty of Economics, Administration and Accounting, Universidade de São Caetano do Sul, São Paulo, Brazil. celsomachado1@gmail.com. Corresponding author.https://orcid.org/0000-0003-3835-2979
** Full Professor, Faculty of Economics, Administration and Accounting, Universidade de São Paulo, São Paulo, Brazil. daielly@usp.br https://orcid.org/0000-0001-6320-3268
*** Full Professor, Faculty of Economics, Administration and Accounting, Universidade de São Paulo, São Paulo, Brazil. backx@usp.br https://orcid.org/0000-0001-7727-0656
**** Full Professor, Department of Biological Sciences and Sustainability, Universidade Paulista, São Paulo, Brazil. crisjaciara@gmail.com
Received: 14-apr-2020 Accepted: 13-may-2021 Available on line: 22-oct-2021
How to cite: Machado Júnior, C., Ribeiro, D. M. N. M., Viana, A. B. N. & Furlaneto, C. J. (2021). The development of cities supported by communication and information technologies. Estudios Gerenciales, 37(161), 657-667. https://doi.org/10.18046/j.estger.2021.161.3973
This research aims to analyze the relationship between economic, social and digital performance in cities of different sizes in Brazil. Data provided by the following official agencies: National Treasury Secretariat, National Mayors' Front and Risk Classification Agency were used. Pearson's correlation was used to identify the influence of digital, social, and economic performance variables in cities divided into groups based on the number of inhabitants. There was a strong correlation between Communication and Information Technologies and social and economic aspects. The greater the needs of cities, the more intense is the use of Communication and Information Technologies, reinforcing the establishment of the perspective of smart cities.
JEL classification: H52; H75; I21.
Keywords: smart cities; sustainable society; digital indicators; social development.
Esta investigación tiene como objetivo analizar la relación entre el desempeño económico, social, y digital en ciudades de diferentes tamaños en Brasil. Se usaron datos proporcionados por los siguientes organismos oficiales: Secretaría del Tesoro Nacional, Frente Nacional de Alcaldes y Agencia de Clasificación de Riesgos. La correlación de Pearson se utilizó para identificar la influencia de las variables de desempeño digital, social y económico en las ciudades. Se observó una fuerte correlación entre las Tecnologías de la Información y la Comunicación y los aspectos sociales y económicos; cuanto mayores son las necesidades de las ciudades, más intenso es el uso de las Tecnologías de la Información y la Comunicación, reforzando el establecimiento de la perspectiva de las ciudades inteligentes.
Palabras clave: ciudades inteligentes; sociedad sostenible; indicadores digitales; desarrollo social.
Esta pesquisa apresenta como objetivo, analisar a relação entre o desempenho econômico, social e digital em cidades de diferentes de diferentes tamanhos no Brasil. Para isso, foram usados dados fornecidos pelas seguintes agências oficiais: Secretaria do Tesouro Nacional, Frente Nacional de Prefeitos e Agência Classificadora de Riscos. A correlação de Pearson foi utilizada para identificar a influência das variáveis de desempenho digital, social e econômico, de cidades divididas em grupos baseados no número de habitantes. Observou-se uma forte correlação entre as Tecnologias da Informação e Comunicação e os aspectos sociais e econômicos. Quanto maiores são as necessidades das cidades, mais intensa é a utilização das Tecnologias da Informação e Comunicação, reforçando o estabelecimento da perspectiva de cidades inteligentes.
Palavras chave: cidades inteligentes; sociedade sustentável; indicadores digitais; desenvolvimento social.
The question of how social arrangements contribute to the performance of cities has attracted the atten-tion of many researchers interested in understanding the factors involved in the best performance of cities and the indicators used to measure this performance (Amankwaa & Blay's, 2018). With the establishment of standards of municipal management as benchmark-ing, city managers can identify strategic plans and activities that generate social and economic deve-lopment for citizens. The positioning of cities as cen-ters of development, through superior performance indicators (with emphasis on science) makes them attractive to companies and individuals (Giffinger & Gudrun, 2010), and helps retain economic and social actors who are already in the locality.
Cities should not be analyzed only in terms of the problems they present, but also in terms of the social development potential of the people who com-pose them. For Prado-Lorenzo, García-Sánchez, and Cuadrado-Ballesteros (2012) the analysis of cities is not limited to negative factors such as pollu-tion, crime, congestion, among others; for them, the understanding of cities must establish an approach that incorporates the sources of development and innovation, which amalgamate the poles of economic, social, environmental, and cultural incentives, bene-ficial to society.
The behavior of cities is analyzed under different conceptual approaches, which are still in the conso-lidation phase. As indicated by Tanguay, Rajaonson, Lefebvre and Lanoie (2010) and Ahvenniemi, Huovila, Pinto-Seppä and Airaksinen (2017) despite the exis-tence of common elements, in the conceptual pro-positions of the cities, there is a distinction in the approaches of the economic, social, environmental, and technological variables presented in the con-ceptual consolidation. The study by Fu and Zhang (2017) orders a thematic evolution of research on ci-ties. In the study, the authors identified that over time there has been an alternation of concepts used in city studies, with emphasis on the terms eco-city, green city, sustainable city, habitable city, city of knowled-ge, ubiquitous city, low carbon city, information city, and smart city - more recently added to these concepts - that of sanctuary city proposed by Ridgley (2011) and resilient city analyzed by Ribeiro and Gonçalves (2019).
A recent study by Machado Jr., Ribeiro, Pereira and Bazanini (2018) found that municipal managers in Brazil develop monitoring and action plans supported by Co-mmunication and Information Technologies (ICT) and socioeconomic indicators, characterizing management in perspective of the smart city concept. It is worth men-tioning that recent studies address the association of the concept of smart cities with that of sustainable city, proposing the concept of smart and sustainable cities (Duvier, Anand & Oltean-Dumbrava, 2018; Bibri, 2018a; Bibri, 2018b; Ibrahim, El-Zaart & Adams, 2018; Yadav, Mangla, Luthra & Rai, 2019; Martin, Evans, Karvonen, Paskaleva, Yang & Linjordet, 2019). Although the subject of smart city is still under construction, Kummitha and Crutzen (2017) consider it an approach that can bring about positive social changes through the adoption of ICTs. The establishment of smart cities involves the provision of better services and digital access through the adoption of digital and technological resources to improve the economic conditions of the city; thus, the relevance of digital access matters to knowledge in cities is positioned as an element of interest to society. In this context, the objective of the present study is to analyze the relationship between economic, social, and digital performance in cities of different sizes in Brazil.
This introduction aims to present the research topic and justify the adequacy of the proposed research. In the sequence, the other sections present the theo-retical framework that supports the research and the methodology adopted for the collection of data, the presentation and analysis of the results obtained - which in the sequence are discussed together with the elaborated theory - and finally, the conclusions of the research are presented.
In the early 1960s, Webber (1964) proposed the concept of city as the center of citizen relations to be replaced by a new configuration dominated by social networks and supported by relationships with virtual connections. From Webber's point of view, ICTs ha-ve a greater influence on the establishment of social networks than the geographic space in which these networks are located; thus, cities would have little influence on the ordering of social arrangements, which would be established through the influence of common interests and shared virtually. ICTs incorpo-rate communication systems, information processing approaches, and data collection automation to sys-tematize and automate planning and management (Faheem, Shah, Butt, Raza, Anwar, Ashraf, Ngade, & Gungor, 2018). The internet of Things (IoT), Big data, Blockchain, and Artificial Intelligence (AI) are some of the resources that make up ICTs.
Although the concepts proposed for smart cities are not yet consolidated, two perspectives stand out. The first deals with the relevance of ICTs for the provision of adequate infrastructure (Hollands, 2008), and the se-cond deals with the importance of social development to offer the best possible quality of life (Bakıcı, Almirall & Wareham, 2013; Heaton, & Parlikad, 2019). These approaches are not mutually exclusive, but synergistic.
Adopting the approach presented by Webber (1964) and contextualizing the current advances in ICTs and society, it becomes possible to identify in the studies by Amankwaa and Blay's (2018), Di Dio et al. (2018), Zong and Zhang (2019) and Clarry, Imani and Miller (2019) the influence of smartphones in the establishment of new spatial and social contexts in cities. The simplicity of using smartphones, thanks to their portability and connectivity, allows virtual access with instant and un-limited effect. According to the authors, the benefits of using smartphones are closely related to the con-cept of smart cities in the organization of smart urban planning. City managers must provide creative and in-clusive urban spaces, in which the services provided are of high quality and supported by ICT systems. In this sense, Amankwaa and Blay's (2018) observe that the city of London builds a behavior of individuality on the part of its inhabitants associated with the trends ob-served to establish virtual social arrangements.
The ICT systems, in which smartphones are incorporated, have established a new paradigm for public managers. This paradigm is in line with the approach of smart cities under construction, and su-pported by intricate social changes to ICTs, as propo-sed by Kummitha and Crutzen (2017). Thus, the focus of the municipal manager is on expanding the city's com-petitiveness and attractiveness, expressed in terms of the provision of socioeconomic and environmental improvements supported by an adequate logistical structure (Graham & Marvin, 2001). The management of a city allows to improve the standard of living of its inhabitants using ICTs. Neirotti et al. (2014) present a perspective in which the qualification of human capi-tal of a municipality enhances access to a smart city, thus, the combination of intensive ICT employment with people's social advancement contributes to its esta-blishment (Kummitha & Crutzen, 2017).
Initiatives by municipal managers who seek to position their locations as smart cities can be seen in various regions of the world. These initiatives are usu-ally proposed by municipal managers and supported by innovative technological solutions, which address current and potential problems, large or small (Bibri, 2018a; Malik, Sam, Hussain & Abuarqoub, 2018; Bouz-guenda, Alalouch & Fava, 2019). Efforts to identify and publicize the actions developed by municipal managers can be seen at events such as the IBM Smarter Cities Challenge, which aims to analyze and disseminate innovative solutions supported by ICTs. Wiig (2016) developed an analysis within the Smarter Cities Cha-llenge to identify cities that made significant urban changes guided by a logical and targeted treatment of the available data, thus positioning themselves wit-hin the smart cities approach. However, the author criticizes cities that offer digital changes, which do little to mitigate existing social inequalities and, instead, aim to present a contemporary self-image and to engage in the global economy. This approach by Wiig (2016) is still controversial, since the study by Weiss, Bernardes, and Consoni (2015) concluded that public services are more efficient in cities that have implemented services incorporating innovations supported by ICTs.
It is worth mentioning, that the Internet of Things (IoT) is positioned as an important factor in the process of improving people's quality of life through the integration of technologies and infrastructure in the consolidation of the concept of smart cities (Khan, Babar, Ahmed, Shah & Han, 2017; Bibri, 2018a; Silva, Khan & Han, 2018; Malik, Sam, Hussain & Abuarqoub, 2018; Rathore, Paul, Hong, Seo, Awan & Saeed, 2018).
Based on the discussion of the benefits of using ICTs to establish the concept of smart cities, Mora, Bolici and Deakin (2017) point out in their literature review, that studies carried out in the context of smart cities are more focused on technological aspects, thus requiring greater attention to factors such as social intelligence, cultural artifacts, and environmental at-tributes. In this perspective, ICTs are considered re-levant, but they must be analyzed in the social, cultural, and environmental context of the community. Thus, ICTs have the potential to help municipal managers to develop innovative solutions for the most diverse social problems, as proposed by Gil-Garcia, Pardo, and Nam (2015). It is worth mentioning, that the focus of attention of smart cities must be directed towards citizens and smart communities. It is therefore necessary to use the city resources to provide a better quality of life for people.
An aspect underlying the concept of smart cities is the expansion of the responsibility of municipal mana-gers, as highlighted by Ultramari, Silva, and Meister (2018). The expansion of the managerial performance spectrum incorporates a greater responsibility asso-ciated with the demands of the people of a city. Efforts to provide better conditions for citizens are considered objectives to be fulfilled by the municipal manager. In this way, needs that were previously interpreted as latent, now have the status of demands to be met by municipal managers, who commit themselves to solving social problems, incorporating the approach of smart cities.
A relevant perspective of the contribution of the concept of smart cities, that is not related to ICTs is presented by Grimaldi, Fernandez, and Carrasco (2019). The authors address the social importance of recovering regions with a large volume of closed sto-res, interpreted as decertified. The authors develop an approach that prioritizes the opening of new stores between empty locations based on business and social criteria, thus enabling the urban and social recovery of the region. Then, it is identified that initiatives led by the private sector can meet business and social objecti-ves (Grimaldi, & Fernandez, 2017; Harris, 2015; Ziehl, & Oßwald, 2015).
Smart cities are structured through the combination of ICT facilities, with the presence of qualified workers attracted by a better quality of life. This combination of skilled labor and ICT enhances the economic de-velopment of the locality, mainly in activities related to technology and knowledge. The research by Adler, Florida, King and Mellander (2019) that analyzes cities and high-tech startups, indicates that local diversity and specialization, combined in a geographic space, enhance innovation and economic development. The-se researchers observed the emergence of high-tech business clusters and ecosystems, corresponding to two geographic profiles. The first profile consists of a small number of global cities and metropolitan areas, and the second consists of a high concentra-tion of activities in small neighborhoods within these same metropolises. The city of London, as observed by Foord (2013), fits this profile as it is contextualized within the geography of creative and digital economies. According to the author, the current London busi-ness cluster is made up of small and medium-sized companies, which are organized in networks with fragile ties, characterized by vitality in their activities, and identified with urban economies.
The concentration of companies and knowledge of high technology in global cities, results from the easy access to complex productive chains, and the diversity of specialized labor markets (Scott, 2006; Kong, 2020). In addition, Evans (2012) and McCann and Van Oort (2019) include, as collaborative elements, the existence of public cultural institutions and net-works of artistic organizations that encourage the so-called soft innovation, which is characterized as intelligent, intuitive, and valuable, and which anyone in an organization can imagine (Stoneman, 2010; Cock-ayne, 2016). This context is important, as it allows the reduction of transaction costs in creative work, which is developed in projects organized by short-term al-liances, among individual creative specialists (Pratt, 2006; Taylor, 2015; Haans & Van Witteloostuijn, 2018). The creative process, however, must be open to new contributions which are more likely to occur in cities with economies based on trade (MacGregor, 2012; Duvivier, Polèse & Apparicio, 2018), characteristics of large cities where activities occur in various eco-nomic segments with unpredictable changes in tastes, values, and feelings. Corroborating this profile, De Propris and Hypponen (2008) and Evans (2019) em-phasize the importance of openness to new actors in creative processes as a counterpoint to the fixation of various creative skills in certain urban places. The next section presents the methodology used in the present research.
The documentary research technique was used employing reports and yearbooks published by the Brazilian government. The data were provided by the federal government in the form of seventeen indicators of effective performance in Brazilian municipalities, and later consolidated and released by the Instituto Brasileiro de Geografia e Estatística (IBGE). The data are based on prior consolidation made available in a report by Austin Rating, a risk rating agency that grou-ped the indicators released by Brazilian municipalities into categories. The present study focuses on digital, social, and economic indicators.
The methods and techniques used to obtain the data are based on approaches carried out in similar re-search. Among the studies that adopt a similar metho-dology, the following stand out: (i) the analysis of 287 Chinese cities supported by a federal government yearbook (Yang, Xu & Shi, 2017); (ii) the use of population survey data developed in the UK government (Webb, Hawkey & Tingey, 2016); and (iii) data collected in local policy reports, local planning documents, and spe-cialized magazines and maps of the city of Novi Sad in Serbia (Mrkajić & Anguelovski, 2016).
This research was developed in a four-stage dynamic: (1) to establish which institutions dissemi-nate relevant information about cities, (2) to identify and select relevant indexes for the comparison pro-cess, (3) to identify cities relevant to the composition of groups of comparison, and (4) selection and appli-cation of mathematical (statistical) models to identify differences between groups. More details of each stage are presented below.
Stage (1). In Brazil, municipalities send their per-formance information to different federal agencies. Since the imposition of the so-called transparency laws, these bodies have been providing information to society; some of them are (i) the Secretaria do Tesouro Nacional (STN), which systematically recei-ves and supervises the information provided by the municipalities, who in turn are responsible for carrying out the surveys; (ii) the Frente Nacional de Prefeitos (FNP), which generates a diagnosis of the financial situation of the municipalities, the results obtained by this institution were published in the ‘Multicidades’ report; and (iii) Risk Rating Agency - Austin Rating -, whose report is based on official data to develop an analysis of the best cities in Brazil. The survey data was used to consolidate the information dissemina-ted over a ten-year analysis period, from 2007 to 2016. The average values were used to eliminate any non-random variations in performance.
Stage (2). In view of the amount and diversity of available municipal information, this research selec-ted the following variables: i) three digital performance indicators: Digital Indicators, Digital Mobility and Di-gital Knowledge Access; ii) Social indicator, formed by: Quality of Life, Education, Health, Housing, Social Responsibility, Attention to Young People, and Human Development; iii) Economic Indicator, formed by: Life Standard, Labor Market, and Foreign Trade; iv) Ge-neral Indicator that in addition to aggregating the social and economic indicators already presented, also incorporates the following fiscal indicators: Funding Capacity, Budget Execution, Application: Health and Education, Financial Sustainability.
Stage (3). In this stage, Brazilian cities were di-vided into three groups according to the number of inhabitants: (i) small cities (municipalities with up to 50,000 inhabitants); (ii) medium-sized cities (muni-cipalities with 50,000 to 200,000 inhabitants); and (iii) large cities (municipalities with more than 200,000 inhabitants). Brazil has 5,570 cities (including the Fe-deral District of Brasília) categorized according to the number of inhabitants. Due to the large number of cities involved, and because they are not divided equally in terms of number of inhabitants, the study analyzed only the 50 cities with the best indicators in each group (small, medium, and large), these cities were surveyed for each indicator, and this resulted in a total of 181 cities selected for analysis. This approach was adopted to establish uniformity in the development of correlation analyzes.
Stage (4). In this phase of the research, a statisti-cal analysis of the data collected in the previous steps was carried out. The analysis techniques were chosen according to the proposed objective to expand the knowledge of the area. The data were inserted and analyzed in a database prepared by the authors, con-taining the seventeen indicators presented in stage (2) originating from three different sources indicated in stage (1) made up the analysis data. It is worth mentioning that the indicators used were obtained directly from the research sources, this experiment did not perform any composition to establish a new indicator.
The analysis was performed only for Brazilian citi-es, which is a limitation of this study; however, with the necessary caveats, the results can be applied to other contexts.
This section presents and analyzes the data collec-ted for this study. It should be noted that many factors can influence cities positively or negatively in their goal to become smart. These factors can act in isolation or be influenced by other variables. This research ana-lyzes the relationship that digital indicators have with social, economic variables and within the scope of the general sum of the indicators. Table 1 shows the correlation indexes for these variables, segmented by city size.
The Pearson correlation values in Table 1 indicate the existence of a strong relationship between the digital indicators and the social, economic, and gene-ral indicators. Although all groups show a strong correlation, the strongest association is in the medium-sized cities.
Table 1. Pearson correlation values for digital indicator performance
|
City size |
Indicator |
||
|
Social |
Economic |
General |
|
|
Big |
0.857962 |
0.966626 |
0.937385 |
|
Medium |
0.985950 |
0.981965 |
0.975186 |
|
Small |
0.971767 |
0.939401 |
0.934531 |
|
All |
0.919190 |
0.684369 |
0.712138 |
Source: own elaboration.
In Figures 1, 2 and 3, the dispersion of the digital indicator is analyzed against the other indicators. Figure 1 shows the dispersion of the digital indicator in relation to the social indicator.
Figure 1 shows that in all three groups there is an adequate dispersion of the digital indicator in relation to the social indicator. Big cities have higher values for social indicators compared to medium-sized cities, which in turn have values higher than those of small cities. Thus, although big cities have a lower Pearson correlation value, their social indicator performance is high in relation to the other groups.
In the next link in the analysis chain, Figure 2 shows the dispersion of the digital indicator in relation to the economic indicator.
Figure 2 shows that the digital indicator presents an adequate dispersion in relation to the economic indicator in all three groups. It is notable that big ci-ties have higher values for economic indicators than medium-sized cities, which in turn have values higher than those of small cities. Thus, although large cities have a lower Pearson correlation value, their economic indicator performance is high in relation to the other groups.
Concluding the Pearson correlation analysis chain and the dispersion of the indicators, Figure 3 shows the dispersion of the digital indicator in relation to the general indicator.
Note: Axis of the abscissa shows the digital indicator, the axis of the ordinates shows the social indicator.
Source: own elaboration.
Figure 1. Dispersion of the digital indicator with the social indicator
Note: Axis of the abscissa shows the digital indicator, the axis of the ordinates shows the economic indicator.
Source: own elaboration.
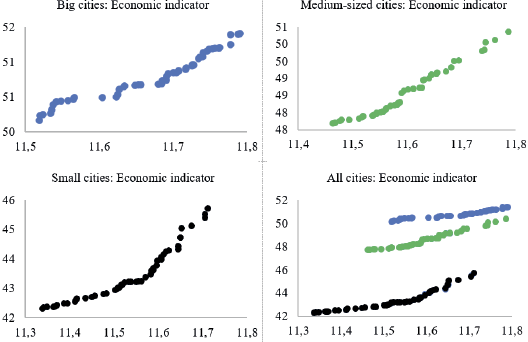
Figure 2. Dispersion of the digital indicator with the economic indicator
Note: Axis of the abscissa shows the digital indicator, the axis of the ordinates shows the general indicator.
Source: own elaboration.
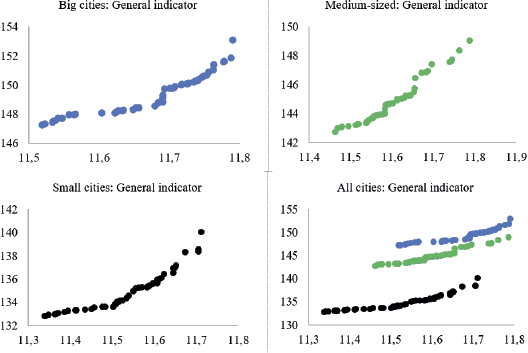
Figure 3. Dispersion of the digital indicator with the general indicator
Figure 3 shows that the general indicator presents an adequate dispersion in relation to the digital in-dicator, as is the case of the social and economic indicators in the three groups. Figure 3 consolidates the superior performance of large cities in relation to the medium ones, and of the medium ones in relation to the small ones. Thus, the superior performance of the indicators in large cities in relation to the other groups is evident, although Pearson's correlation is lower. Finding a lesser Pearson correlation between indicators in large cities can be justified by the fact that large cities have a greater diversity of factors operat-ing in society. Individuals in large cities are subject to a greater volume and diversity of economic activities and have a broader set of cultural, artistic, and sporting options; the correlation of digital indicators with other indicators is, therefore, of slightly lower intensity.
Brazil is a large territory marked by significant differences in economic activity. Thus, the geographic lo-cation of a city has the potential to be a determining fac-tor in its performance in the indicators analyzed in this study. The most recent demographic census (IBGE, 2018) indicates that Brazil is composed of 26 federal states and 5,570 cities The Federal District, also known as Brasilia, is the country's capital, and despite having the size of a city, it holds the status of a State of the Union and elects representatives to the country's national congress.
Figure 4 shows the dispersion of the following in-dicators: digital access to knowledge, digital indicators, and digital mobility of the cities distributed by the states of the Union that form Brazil.
Figure 4 shows that only 10 states and the Federal District contain cities with at least one of the three digital indicators under study. However, Figure 4 also indicates that a significant number of cities with digital indicators are concentrated in the state of São Paulo, differentiating it from other states.
Note: This figure, in axis of the abscissa shows the performance, by state, and in axis of the ordinates, the distribution of the three indicators in cities of different sizes.
Source: own elaboration.
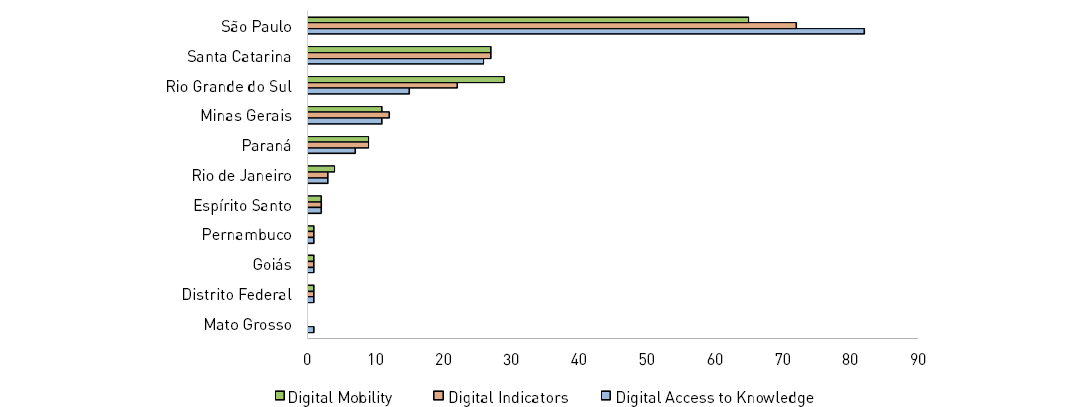
Figure 4. Distribution of indicators by state
Table 2 shows the Brazilian states by region, the number of municipalities, the number of inhabitants, and the average number of inhabitants per municipality. It also shows a total of 181 cities for the 450 indicators analyzed, establishing an average of 2.5 indicators per city. It should be noted that the main factor of analysis is the performance of the indicator, not the city; there-fore, some cities perform well on just one indicator. This context justifies the inclusion of 181 cities in the analysis, instead of just 150, which would be the result if the same cities always obtained the best performan-ce in all indicators. A city can perform better for one or more indicators, limiting itself to the three considered in the analysis. Thus, an average of 2.5 digital indicators shows high performance of these cities in meeting the digital indicators in relation to other cities in the country.
Table 2, referring to the period from 2007 to 2016, shows that the states of the South and Southeast regions have the highest concentration of municipalities with the best performance in digital indicators. The state of São Paulo has 88 municipalities (13.6% of the total) with at least one superior digital performance indica-tor; in the second position, the state of Santa Catarina has 30 municipalities (10.2% of the total); in the third position the state of Rio Grande do Sul with 29 cities (4.8% of the total), and in the sequence the state of Rio de Janeiro with four cities (4.2% of the total). It is also possible to observe six states with less participation of cities with digital indicators. It should be noted that, in the survey, 16 states did not have cities with the best digital performance indicators in the country. The city of Brasilia (Identified in Table 2 as 'Distrito Federal') had 100% participation, which is explained by the fact that it is a differentiated city and presents good performance in the three digital indicators under study.
The states with the highest concentration of cities with superior performance in digital indicators are geographically close, indicating the existence of a re-gion potentially more favorable to the emergence of smart cities. Figure 5 shows the distribution of the 450 superior digital performance indicators by state.
Table 2. Distribution of cities with better digital performance by state and region
|
Region |
State |
Number of cities |
Digital performance |
Participation of cities in the state (%) |
Number of inhabitants* |
Average population |
|
Southeast |
Minas Gerais |
853 |
15 |
1.8 |
21,040,662 |
24,666 |
|
|
São Paulo |
645 |
88 |
13.6 |
45,538,936 |
70,603 |
|
|
Rio de Janeiro |
92 |
4 |
4.2 |
17,159,960 |
186,521 |
|
|
Espírito Santo |
78 |
2 |
2.6 |
3,972,880 |
50,934 |
|
South |
Rio Grande do Sul |
497 |
29 |
5.8 |
11,329,605 |
22,795 |
|
Paraná |
399 |
9 |
2.3 |
11,348,937 |
28,443 |
|
|
Santa Catarina |
295 |
30 |
10.2 |
7,075,494 |
23,984 |
|
|
Northeast |
Bahia |
417 |
- |
- |
14,812,617 |
35,521 |
|
|
Piauí |
224 |
- |
- |
3,264,531 |
14,573 |
|
|
Paraíba |
223 |
- |
- |
3,996,496 |
17,921 |
|
|
Maranhão |
217 |
- |
- |
7,035,055 |
32,419 |
|
|
Pernambuco |
185 |
1 |
0.5 |
9,496,294 |
51,331 |
|
|
Ceará |
184 |
- |
- |
9,075,649 |
49,324 |
|
|
Rio Grande do Norte |
167 |
- |
- |
3,479,010 |
20,832 |
|
|
Alagoas |
102 |
- |
- |
3,322,820 |
32,576 |
|
|
Sergipe |
75 |
- |
- |
2,278,308 |
30,377 |
|
North |
Pará |
144 |
- |
- |
8,513,497 |
59,121 |
|
Tocantins |
139 |
- |
- |
1,555,229 |
11,188 |
|
|
Amazonas |
62 |
- |
- |
4,080,611 |
65,816 |
|
|
Rondônia |
52 |
- |
- |
1,757,589 |
33,799 |
|
|
Acre |
22 |
- |
- |
869,265 |
39,512 |
|
|
Amapá |
16 |
- |
- |
829,494 |
51,843 |
|
|
Roraima |
15 |
- |
- |
576,568 |
38,437 |
|
|
Midwest |
Goiás |
246 |
1 |
0.4 |
6,921,161 |
28,134 |
|
Mato Grosso |
141 |
1 |
0.7 |
3,441,998 |
24,411 |
|
|
|
Mato Grosso do Sul |
79 |
- |
- |
2,748,023 |
34,785 |
|
|
Federal District |
1 |
1 |
100 |
2,974,703 |
- |
|
|
Total |
5,570 |
181 |
*Estimated population.
Source: own elaboration with survey data provided by IBGE (2018).
Source: own elaboration.
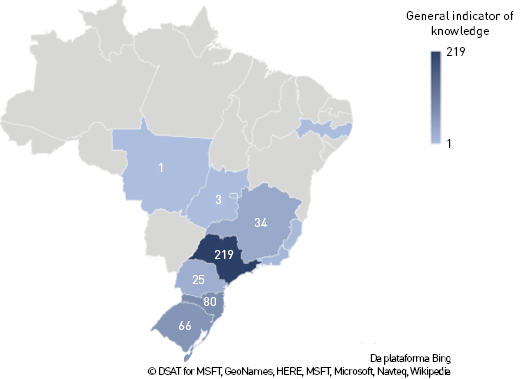
Figure 5. Distribution of superior digital indicators by state
The data show differences in the performance of digital indicators according to the size of the city and in relation to the location in the Brazilian territory. The exploratory nature of this study did not allow the establishment of casual relationships between the indexes analyzed. In this context, an individualized analysis of city performance indicators is established as an opportunity for future studies, because in this approach it will be possible to identify the cause-and-effect relationship between the indicators. The next section discusses that this information is in line with the theoretical structure of this study.
The research carried out by Webber (1964) and Amankwaa and Blay (2018) propose that ICTs establish the possibility of understanding society by organizing itself no longer in terms of its geographical position, but in terms of relationship networks. However, the data analyzed indicates that a limited set of cities has good digital indicators. Cities, which present this good performance of digital indicators, position themselves as attractive to people whose activities are support-ed by ICTs. This fact potentiates the concentration of people in large cities for having better digital indicators, as evidenced in this study, thus corroborating the ap-proach of Kummitha and Crutzen (2017) and Graham and Marvin (2001), in which ICTs are an element of attractiveness of a city, and consequently the possibility of establishing the place as an smart city.
The aspects related to ICTs are relevant to the contextualization of smart cities, as proposed by Mora, Bolici and Deakin (2017); however, as highlighted by Wiig (2016), in smart cities, ICTs must be considered as an element that contributes to the solution of existing social inequalities. The strong correlation between digital indicators (an important component of ICTs) and social and economic indicators shows that ICTs have the potential to generate improvements in society. It is important to note that there is still no data to indi-cate whether digital indicators influence social and economic factors, or whether the relationship between cause and effect is reversed. Cities with better social and economic indicators have greater attention and investments in digital indicators, thus favoring ICTs. Regardless of the discernment of who is the cause and who is influenced, as this relationship may not be distinguishable, the relevant fact is that they are relat-ed to each other and that ICTs can provide beneficial innovations for society. As Bakıcı et al. (2013) observe, and as Gil-Garcia, Pardo and Nam (2015) emphasize, these factors are synergistic, not excluding. In this context, the responsibility of municipal managers for planning and managing the city's digital performance increases with the incorporation of ICTs, as pointed out by Ultramari, Silva and Meister (2018).
A different perspective of this research is the identification of a correlation between digital indicators and economic indicators. This finding is in line with the conclusions of the research by Adler et al. (2019), in which the greatest emergence of high-tech startups in corporate clusters in global cities in metropolitan areas is observed, and in some cases in small districts of these localities. The approach by Adler et al. (2019) is confirmed and expanded by the results identified in this research. However, the data obtained make it possible to expand performance and knowledge of city management as it was identified that large cities have the best digital social and economic indicators. Thus, geographic space, particularly in some large cities, has an influence on the way ICTs combine with economic factors, as observed in the city of London by Foord (2013). It is also noteworthy, that other factors may influence the establishment of high-tech clusters in large cities. For Scott (2006), this concentration results from easy access to complex production chains and the diversity of specialized labor markets. Additionally, for Evans (2012), public cultural institutions and networks of artistic organizations work collaboratively in the constitution of these clusters. In this way, it is evident that intrinsic characteristics of large cities collaborate in obtaining better performance in digital and economic indicators, as well as in the expansion of the regional economy.
This study focuses on Brazilian cities, and in this perspective, it was observed a high concentration of cities with good digital indicators in the southeastern and southern regions, with emphasis on the state of São Paulo and surrounding states. Thus, the state of São Paulo, and from a broader perspective the states of Santa Catarina, Rio Grande do Sul and Rio de Janeiro (all located nearby in the south and southeast), can be seen as potential geographic spaces for the emergence of global smart cities. It is worth mentioning that the state of São Paulo has a particularly active economy, having historically positioned itself as a center for internal immigration. As a result, the state of São Paulo has a greater concentration of economic activity and a greater variety of employment opportunities. These aspects po-tentially favor the emergence of smart cities, as the region is more commercially oriented, as MacGregor (2012) points out, and is more open to new actors, as noted by De Propris and Hypponen (2008). The following section presents the conclusions of this study.
The process of public management of personal needs, associated with the establishment of attractions for social arrangements with specific demands, is po-sitioned as complex because it involves many varia-bles to be met. However, the analysis of some of these variables makes it possible to identify trends and positions made by public management, to establish attractive places of living through the resources of information and communication technologies.
The first aspect to be highlighted in the research is the identification that the good performance of the digital indicators results in a better social and economic performance in the city. This correlation explains the importance of financial resources in the develop-ment of an urban architecture that finances ICTs, and still provides better performance in social indicators. Therefore, the concept of smart cities must consider performance in terms of economic indicators since they are important for the incorporation of ICTs in munici-pal management, as well as for the financing of social policies that provide a better quality of life for people. It should not be concluded that only cities with good economic performance become smart cities; instead, we can infer that urban management supported by the smart cities approach results in better local economic performance.
Large cities have performed better in economic and social indicators than medium and small cities, which makes them better platforms for the development of activities supported by ICTs. It this perspective, a large city can establish a more conducive environment to be-come a smart city. Considering the characteristics of large cities, such as large geographic dimensions, more complex transport logistics, longer commuting times and greater concentration of people, the need for greater planning and actions of public management is identified to solve these problems. This greater pressure on public management favors the introduction of Information and Communication Technology solutions aimed at solving people's needs.
The benefits arising from the use of ICTs by the cities are extended to all individuals who live in the locality. However, people and companies that work directly with ICTs tend to choose settling in the cities that best offer this resource, thus enjoying better social and economic conditions. The proximity of people and companies in places with a better offer of ICT occurs more sharply in activities developed in a virtual environment.
The analysis of the relationship between ICTs and people establishes the reflection of an interesting pa-radox. Although ICTs facilitate communication and relationships between people without the need to be physically close, cities that offer better ICTs are in a favorable position to attract people to a location. This attractiveness results from a better offer of quality of life, and more opportunities for work and business. The cities that offer the most ICTs, attract the people who depend on them the most. Thus, the ICTs instead of expanding the possibilities of housing places, act as a pole of attraction for the people who depend most on it.
This analysis of Brazilian cities shows a greater concentration of cities with good digital indicators in the states of São Paulo and Santa Catarina. Expanding the perspective of the analysis, cities in the Southeast (which includes the state of São Paulo) and the South (which includes the state of Santa Catarina) are among those with the best digital indicators, which points to these regions as the one with the greatest potential for the flourishing of smart cities.
Conflict of interest The authors declare no conflict of interest.
Adler, P., Florida, R., King, K., & Mellander, C. (2019). The city and high-tech startups: The spatial organization of Schumpeterian entrepreneurship. Cities, 87, 121–130. https://doi.org/10.1016/j.cities.2018.12.013
Ahvenniemi, H., Huovila, A., Pinto-Seppä, I., & Airaksinen, M. (2017). What are the differences between sustainable and smart cities? Cities, 60, 234–245. https://doi.org/10.1016/j.cities.2016.09.009
Amankwaa, E. F., & Blay, K. B. (2018). Cities at risk? Exploring the synergies between smartphones and everyday vulnerabilities. Cities, 83, 129–139. https://doi.org/10.1016/j.cities.2018.06.015
Bakıcı, T., Almirall, E., & Wareham, J. (2013). A smart city initiative: The case of Barcelona. Journal of the Knowledge Economy, 4(2), 135–148. https://doi.org/10.1007/s13132-012-0084-9
Bibri, S. E. (2018a). The IoT for smart sustainable cities of the future: An analytical framework for sensor-based big data applications for environmental sustainability. Sustainable Cities and Society, 38, 230-253. https://doi.org/10.1016/j.scs.2017.12.034
Bibri, S. E. (2018b). A foundational framework for smart sustainable city development: Theoretical, disciplinary, and discursive dimensions and their synergies. Sustainable Cities and Society, 38, 758-794. https://doi.org/10.1016/j.scs.2017.12.032
Bouzguenda, I., Alalouch, C., & Fava, N. (2019). Towards smart sustainable cities: A review of the role digital citizen participation could play in advancing social sustainability. Sustainable Cities and Society, 50, 1-15. https://doi.org/10.1016/j.scs.2019.101627
Clarry, A., Imani, A. F., & Miller, E. J. (2019). Where we ride faster? Examining cycling speed using smartphone GPS data. Sustainable Cities and Society, 49, 101594. https://doi.org/10.1016/j.scs.2019.101594
Cockayne, D. G. (2016). Entrepreneurial affect: Attachment to work practice in San Francisco's digital media sector. Environment and Planning D: Society and Space, 34(3), 456-473. https://doi.org/10.1177%2F0263775815618399
De Propris, L., & Hypponen, L. (2008). Creative clusters and governance: The dominance of the Hollywood film cluster. In: Cooke, P. N., & Lazzeretti, L. Creative Cities, Cultural Clusters and Local Economic Development (pp. 258-286). Northhampton: Edward Elgard Publishing.
Di Dio, S., La Gennusa, M., Peri, G., Rizzo, G., & Vinci, I. (2018). Involving people in the building up of smart and sustainable cities: How to influence commuters’ behaviors through a mobile app game. Sustainable Cities and Society, 42, 325-336. https://doi.org/10.1016/j.scs.2018.07.021
Duvier, C., Anand, P. B., & Oltean-Dumbrava, C. (2018). Data quality and governance in a UK social housing initiative: Implications for smart sustainable cities. Sustainable cities and society, 39, 358-365. https://doi.org/10.1016/j.scs.2018.02.015
Duvivier, C., Polèse, M., & Apparicio, P. (2018). The location of information technology-led new economy jobs in cities: office parks or cool neighbourhoods? Regional Studies, 52(6), 756-767. https://doi.org/10.1080/00343404.2017.1322686
Evans, G. L. (2019). Emergence of a digital cluster in east London: Birth of a new hybrid firm. Competitiveness Review: An International Business Journal, 29(3), 253-266.
Evans, G. (2012). Creative Clusters and Innovation. Putting Creativity on the Map, Caroline Chapain, Phil Cooke, Lisa de Propis, Stewart Macneill and Juan Mateos-Garcia (2010). Creative Industries Journal, 4(2), 129-202. https://doi.org/10.1386/cij.4.2.199_7
Faheem, M., Shah, S. B. H., Butt, R. A., Raza, B., Anwar, M., Ashraf, M. W., Ngade, A., & Gungor, V. C. (2018). Smart grid communication and information technologies in the perspective of Industry 4.0: Opportunities and challenges. Computer Science Review, 30, 1-30.
Foord, J. (2013). The new boomtown? Creative city to Tech City in east London. Cities, 33, 51–60. https://doi.org/10.1016/j.cities.2012.08.009
Fu, Y., & Zhang, X. (2017). Trajectory of urban sustainability concepts: A 35-year bibliometric analysis. Cities, 60, 113–123. https://doi.org/10.1016/j.cities.2016.08.003
Giffinger, R., & Gudrun, H. (2010). Smart cities ranking: An effective instrument for the positioning of the cities? ACE: Architecture, City and Environment, 4(12), 7–26. http://dx.doi.org/10.5821/ace.v4i12.2483
Gil-Garcia, J. R., Pardo, T. A., & Nam, T. (2015). What makes a city smart? Identifying core components and proposing an integrative and comprehensive conceptualization. Information Polity, 20(1), 61–87. http://dx.doi.org/10.3233/IP-150354
Graham, S., & Marvin, S. (2001). Splintering Urbanism: Networked Infrastructures, Technological Mobilities and the Urban Condition. London: Routledge.
Grimaldi, D., Fernandez, V., & Carrasco, C. (2019). Heuristic for the localization of new shops based on business and social criteria. Technological Forecasting and Social Change, 142, 249-257.
Grimaldi, D., & Fernandez, V. (2017). The road to school. The Barcelona case. Cities, 65, 24–31. https://doi.org/10.1016/j.cities.2017.01.013
Haans, R. F., & Van Witteloostuijn, A. (2018). Expected job creation across the cultural industries: a sectoral division and its implications for cultural policy. International Journal of Cultural Policy, 24(1), 45-67. https://doi.org/10.1080/10286632.2015.1128420
Harris, E. (2015). Navigating pop-up geographies: urban space-times of flexibility, interstitiality and immersion. Geography Compass, 9(11), 592–603. https://doi.org/10.1111/gec3.12248
Heaton, J., & Parlikad, A. K. (2019). A conceptual framework for the alignment of infrastructure assets to citizen requirements within a Smart Cities framework. Cities, 90, 32-41. https://doi.org/10.1016/j.cities.2019.01.041
Hollands, R. G. (2008). Will the real smart city please stand up? Intelligent, progressive or entrepreneurial? City, 12(3), 303–320. https://doi.org/10.1080/13604810802479126
IBGE. (2018). Conheça cidades e estados do Brasil. Brasília: IBGE. Retrieved on November 28, 2019, from: https://cidades.ibge.gov.br
Ibrahim, M., El-Zaart, A., & Adams, C. (2018). Smart sustainable cities roadmap: Readiness for transformation towards urban sustainability. Sustainable cities and society, 37, 530-540. https://doi.org/10.1016/j.scs.2017.10.008
Khan, M., Babar, M., Ahmed, S. H., Shah, S. C., & Han, K. (2017). Smart city designing and planning based on big data analytics. Sustainable cities and society, 35, 271-279. https://doi.org/10.1016/j.scs.2017.07.012
Kong, L. (2020). From cultural industries to creative industries and back? Towards clarifying theory and rethinking policy. In A. de Dios & L. Kong Chian (Eds.), Handbook on the Geographies of Creativity. Cheltenham: Edward Elgar Publishing.
Kummitha, R. K. R., & Crutzen, N. (2017). How do we understand smart cities? An evolutionary perspective. Cities, 67, 43–52. https://doi.org/10.1016/j.cities.2017.04.010
Machado Jr., C., Ribeiro, D. M. N. M., Pereira, R. S., & Bazanini, R. (2018). Do Brazilian cities want to become smart or sustainable? Journal of Cleaner Production, 199, 214–221. https://doi.org/10.1016/j.jclepro.2018.07.072
MacGregor, N. (2012). Keynote speech, World Cities Summit, City Hall, London, August 1. Retrieved on November 28, 2019, from: https://n9.cl/p5n3m
Malik, K. R., Sam, Y., Hussain, M., & Abuarqoub, A. (2018). A methodology for real-time data sustainability in smart city: Towards inferencing and analytics for big-data. Sustainable Cities and Society, 39, 548-556. https://doi.org/10.1016/j.scs.2017.11.031
Martin, C., Evans, J., Karvonen, A., Paskaleva, K., Yang, D., & Linjordet, T. (2019). Smart-sustainability: A new urban fix?. Sustainable cities and society, 45, 640-648. https://doi.org/10.1016/j.scs.2018.11.028
McCann, P., & Van Oort, F. (2019). Theories of agglomeration and regional economic growth: a historical review. In R. Capello & P. Nijkamp (Eds.), Handbook of regional growth and development theories (6-23). Cheltenham: Edward Elgar Publishing. https://doi.org/10.4337/9781788970020
Mora, L., Bolici, R., & Deakin, M. (2017). The first two decades of smart-city research: A bibliometric analysis. Journal of Urban Technology, 24(1), 3–27. https://doi.org/10.1080/10630732.2017.1285123
Mrkajić, V., & Anguelovski, I. (2016). Planning for sustainable mobility in transition cities: Cycling losses and hopes of revival in Novi Sad, Serbia. Cities, 52, 66–78. https://doi.org/10.1016/j.cities.2015.11.029
Neirotti, P., Marco, A. D., Cagliano, A. C., Mangano, G., & Scorrano, F. (2014). Current trends in smart city initiatives: Some stylised facts. Cities, 33, 25–36. https://doi.org/10.1016/j.cities.2013.12.010
Prado-Lorenzo, J. M., García-Sánchez, I. M., & Cuadrado-Ballesteros, B. (2012). Sustainable cities: Do political factors determine the quality of life? Journal of Cleaner Production, 21(1), 34–44. https://doi.org/10.1016/j.jclepro.2011.08.021
Pratt, A. C. (2006). Advertising and creativity, a governance approach: a case study of creative agencies in London. Environment and planning A, 38(10), 1883-1899. https://doi.org/10.1068%2Fa38261
Rathore, M. M., Paul, A., Hong, W. H., Seo, H., Awan, I., & Saeed, S. (2018). Exploiting IoT and big data analytics: Defining smart digital city using real-time urban data. Sustainable cities and society, 40, 600-610. https://doi.org/10.1016/j.scs.2017.12.022
Ribeiro, P. J. G., & Gonçalves, L. A. P. J. (2019). Urban resilience: A conceptual framework. Sustainable Cities and Society, 50, 1-11. https://doi.org/10.1016/j.scs.2019.101625
Ridgley, J. (2011). Refuge, refusal, and acts of holy contagion: The city as a sanctuary for soldiers resisting the Vietnam War. ACME: An International E-Journal for Critical Geographies, 10(2), 189-215.
Scott, A. J. (2006). Creative cities: Conceptual issues and policy questions. Journal of Urban Affairs, 28(1), 1–17. https://doi.org/10.1111/j.0735-2166.2006.00256.x
Silva, B. N., Khan, M., & Han, K. (2018). Towards sustainable smart cities: A review of trends, architectures, components, and open challenges in smart cities. Sustainable Cities and Society, 38, 697-713. https://doi.org/10.1016/j.scs.2018.01.053
Stoneman, P. (2010). Soft innovation: economics, product aesthetics, and the creative industries. Oxford: Oxford University Press. https://doi.org/10.1093/acprof:oso/9780199572489.001.0001
Tanguay, G. A., Rajaonson, J., Lefebvre, J., & Lanoie, P. (2010). Measuring the sustainability of cities: An analysis of the use of local indicators. Ecological Indicators, 10, 407–418. https://doi.org/10.1016/j.ecolind.2009.07.013
Taylor, C. (2015). Between culture, policy and industry: Modalities of intermediation in the creative economy. Regional Studies, 49(3), 362-373. https://doi.org/10.1080/00343404.2012.748981
Ultramari, C., da Silva, R. C. D. O., & Meister, G. (2018). Idealizing Brazilian cities: Their master plans from 1960 through 2015. Cities, 83, 186–192. https://doi.org/10.1016/j.cities.2018.06.021
Webb, J., Hawkey, D., Tingey, M. (2016). Governing cities for sustainable energy: the UK case. Cities, 54, 28-35. https://doi.org/10.1016/j.cities.2015.10.014
Webber, M. (1964). The urban place and the non-place urban realm: Explorations into urban structure. New York: Plenum Press.
Weiss, M. C., Bernardes, R. C., & Consoni, F. L. (2015). Cidades inteligentes como nova prática para o gerenciamento dos serviços e infraestruturas urbanos: a experiência da cidade de Porto Alegre. Revista Brasileira de Gestão Urbana, 7(3), 310–324.
Wiig, A. (2016). The empty rhetoric of the smart city: From digital inclusion to economic promotion in Philadelphia. Urban Geography, 37(4), 535–553. https://doi.org/10.1080/02723638.2015.1065686
Yadav, G., Mangla, S. K., Luthra, S., & Rai, D. P. (2019). Developing a sustainable smart city framework for developing economies: An Indian context. Sustainable Cities and Society, 47, 1-17. 101462. https://doi.org/10.1016/j.scs.2019.101462
Yang, B., Xu, T., & Shi, L. (2017). Analysis on sustainable urban development levels and trends in China’s cities. Journal of Cleaner Production, 141, 868–880. https://doi.org/10.1016/j.jclepro.2016.09.121
Ziehl, M. & Oßwald, S. (2015). Practices in second hand spaces: producing value from vacancy. Ephemera Theory Politics in Organization, 15(1), 263–277.
Zong, W., & Zhang, J. (2019). Use of smartphone applications and its impacts on urban life: A survey and random forest analysis in Japan. Sustainable Cities and Society, 49, 1-31, 101589. https://doi.org/10.1016/j.scs.2019.101589